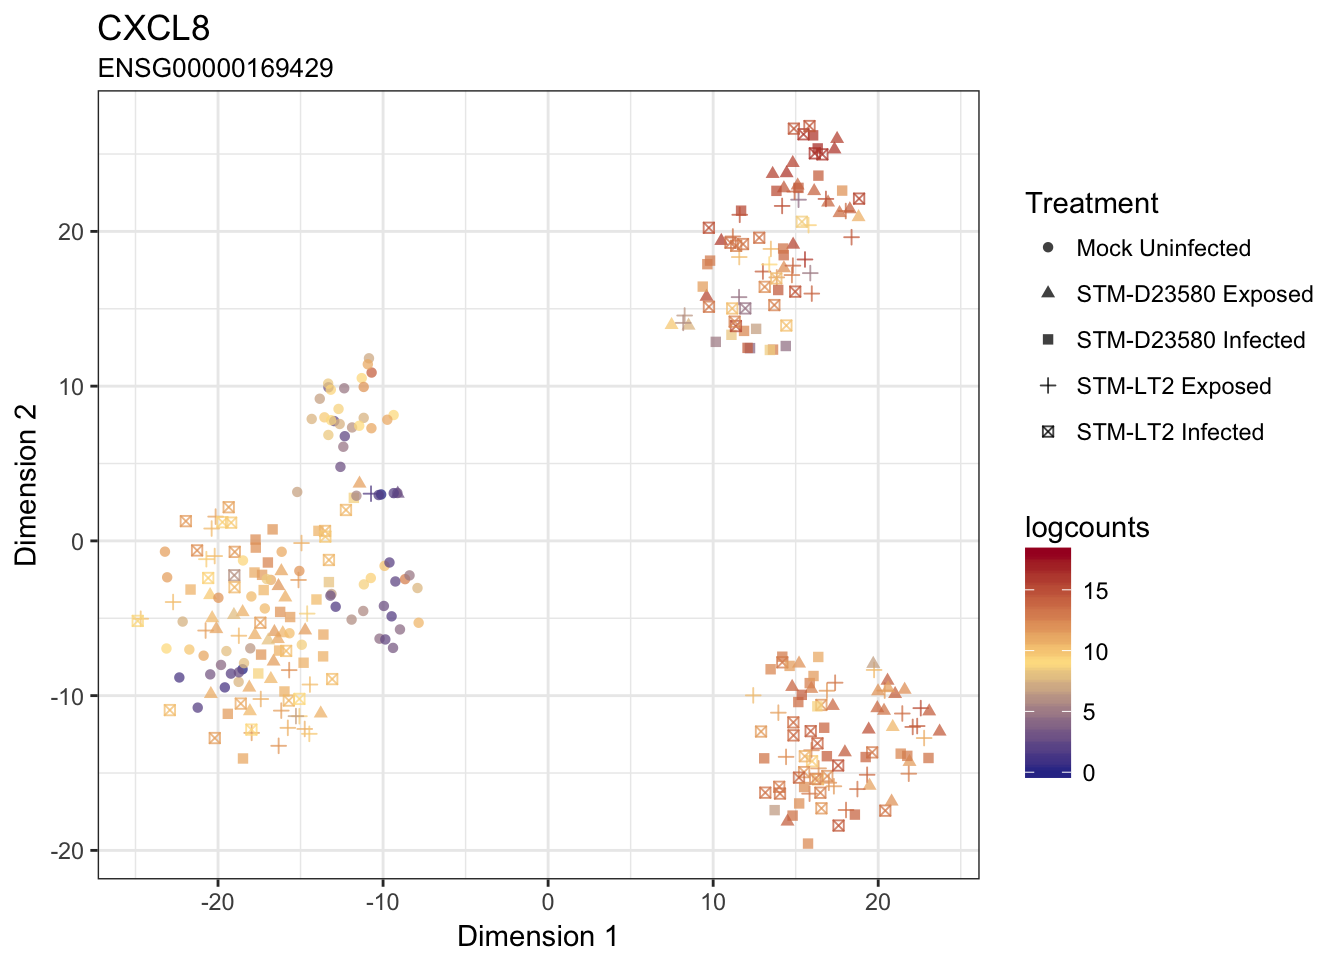
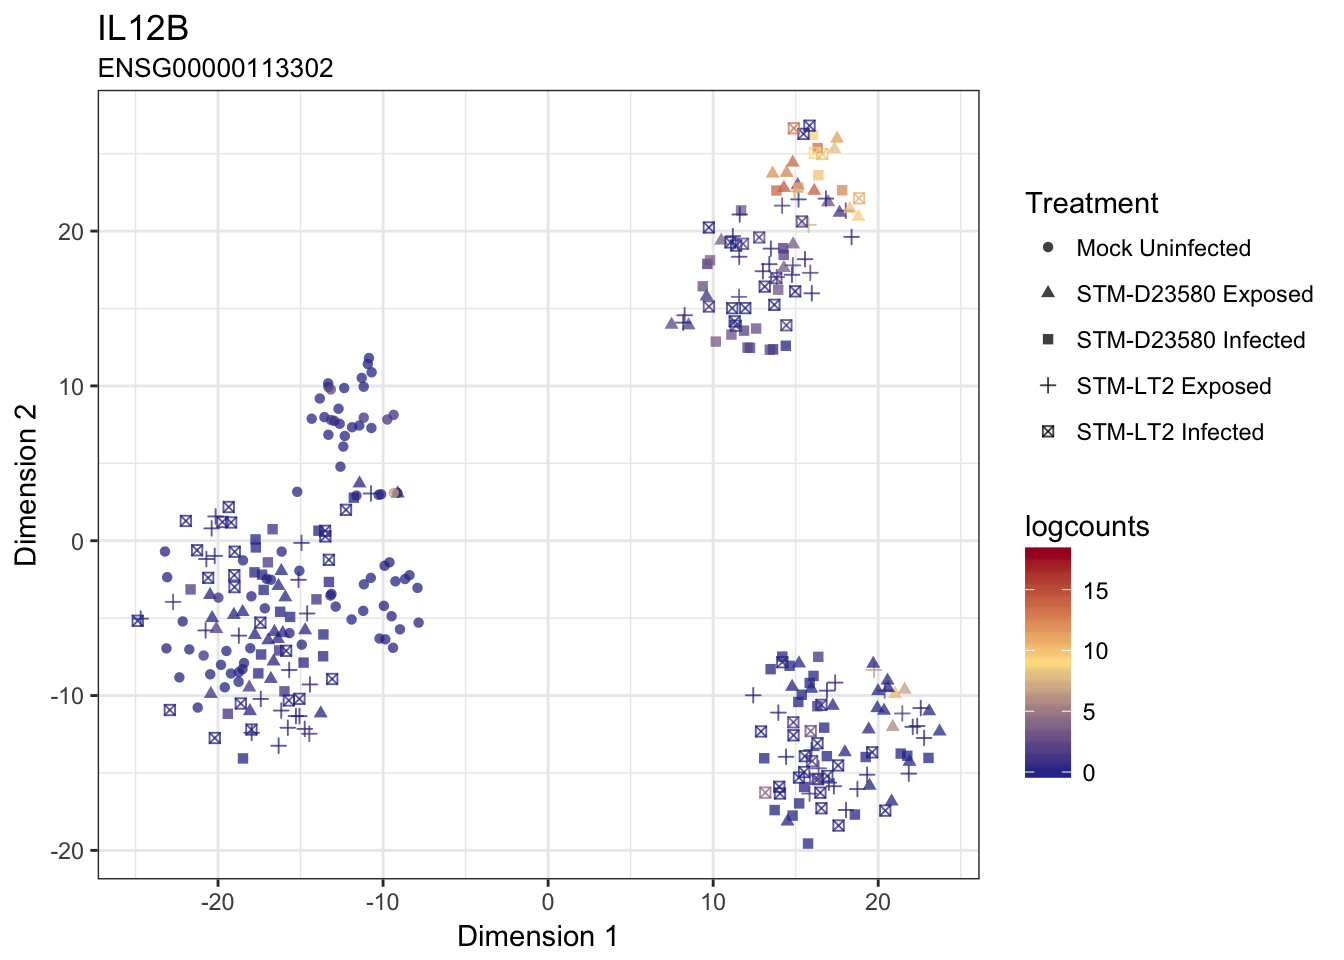
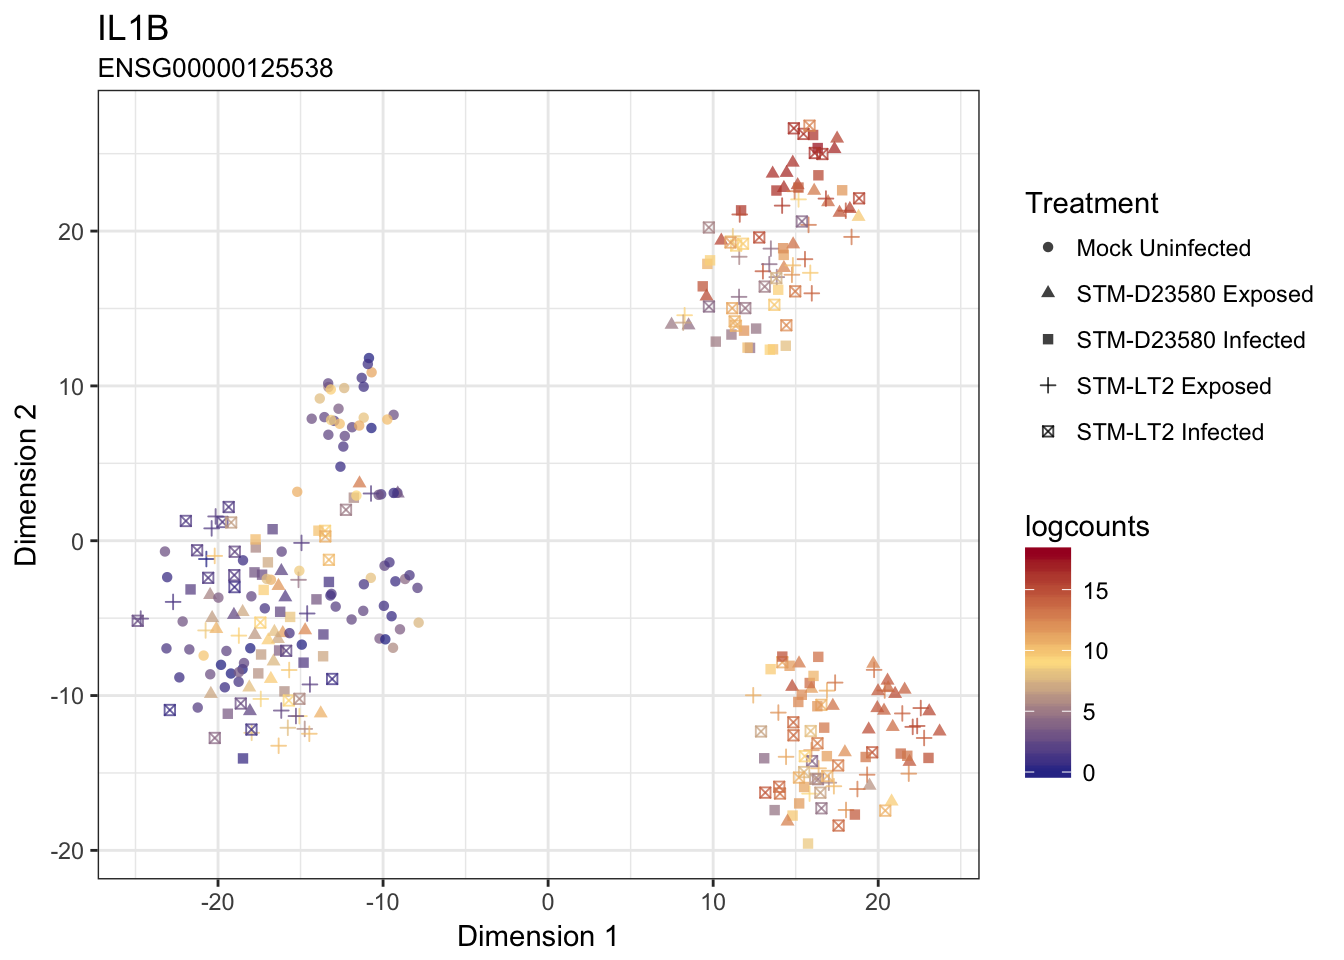
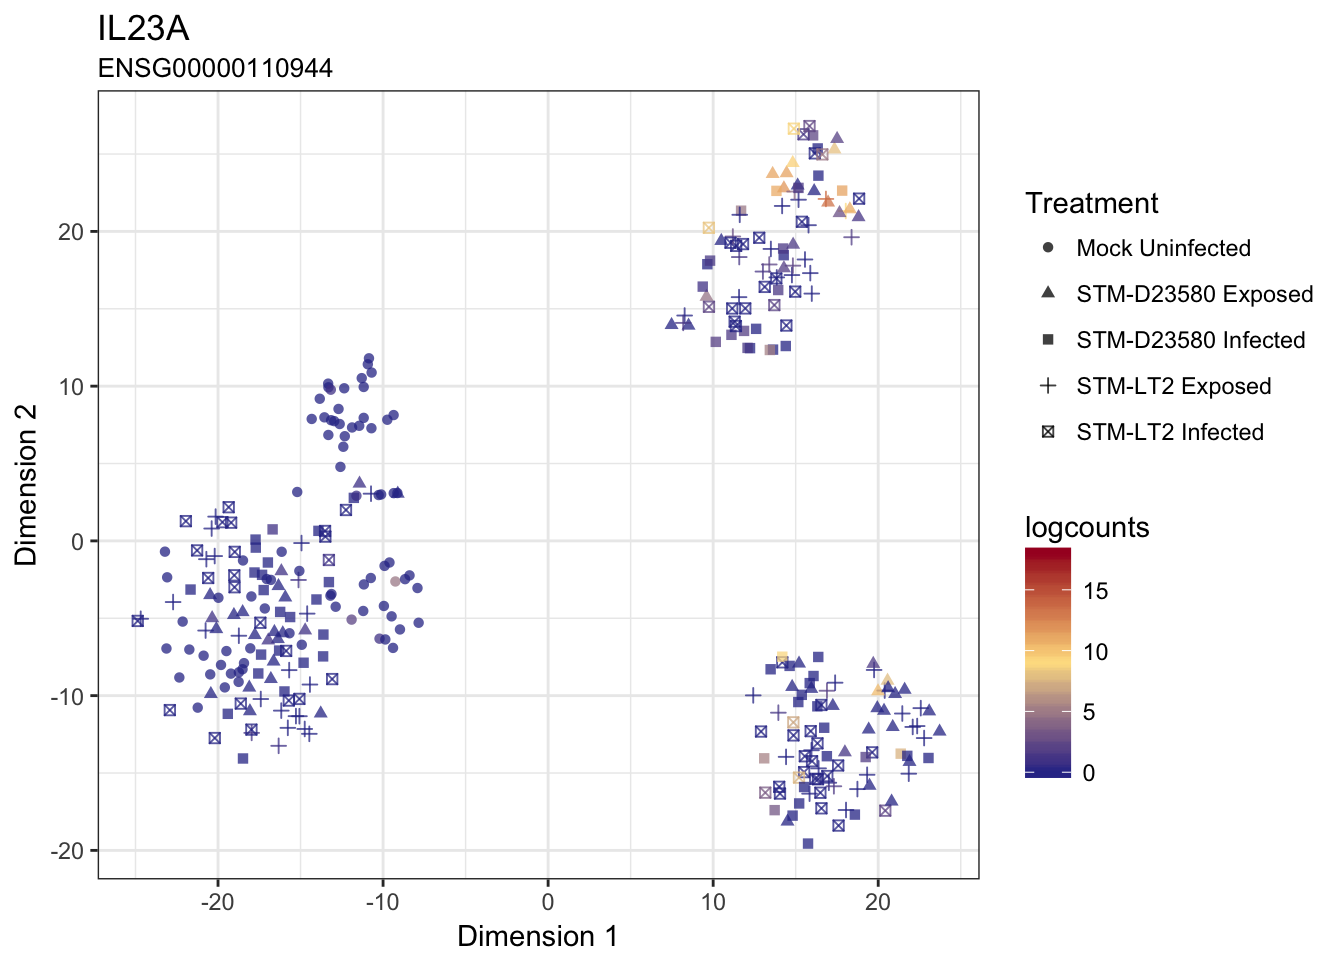
Gene expression levels overlaid onto t-SNE view
Helper values and functions
Let us first define some values useful to design colour scales:
range.exprs <- range(assay(sce.endo, "logcounts"))
col.gene <- RColorBrewer::brewer.pal(11, "RdYlBu")
col.treatment <- RColorBrewer::brewer.pal(9, "Paired")[c(9,3,1,4,2)]
names(col.treatment) <- levels(sce.endo$Treatment)
Let us then define a few convenience functions:
- to fetch the gene ID associated with a gene name
geneNameToID <- function(x){
  geneId <- with(rowData(sce.endo), gene_id[match(x, gene_name)])
  if (length(geneId) > 1){
    warning("Multiple IDs found. Use ID instead")
    return(data.frame(
      gene_name = x,
      gene_id = geneId
    ))
  } else if (length(geneId) == 0){
    stop("gene_name not found")
  }
  return(geneId)
}- to fetch the necessary expression and phenotype data
geneDataByName <- function(x){
  geneId <- geneNameToID(x)
  ggData <- data.frame(
    gene = assay(sce.endo, "logcounts")[geneId,],
    dimension1 = reducedDim(sce.endo, "TSNE")[,1],
    dimension2 = reducedDim(sce.endo, "TSNE")[,2],
    colData(sce.endo)[,c("Time","Infection","Status","Treatment")]
  )
  return(ggData)
}- to draw the figure
plotByName <- function(x){
  geneId <- geneNameToID(x)
  ggData <- geneDataByName(x)
  # return(ggData)
  ggplot(ggData, aes(dimension1, dimension2, shape = paste(Infection, Status))) +
    geom_point(aes(colour = gene), alpha = 0.75, size = 1.5) +
    scale_color_gradient2(
      low = col.gene[11], mid = col.gene[5], high = col.gene[1],
      midpoint = mean(range.exprs),
      limits = range.exprs
    ) +
    scale_fill_manual(values = col.treatment) +
    labs(
      title = sprintf("%s", x),
      subtitle = sprintf("%s", geneId),
      x = "Dimension 1",
      y = "Dimension 2",
      colour = "logcounts",
      fill = "Treatment",
      shape = "Treatment") +
    theme_bw()
}
Genes (alphabetical order)
The above convenience function make it straightforward to produce a figure for any gene of interest:
IL12B
IL1B
IL23A
CXCL8