Identification of unsupervised clusters
Prepare data
Note: for this analysis, the data is prepared identically to the differential expression between experimental groups using scde:
- ERCC spike-in features are removed,
- Cells in the data set is subsetted by time point,
- Genes in the data set are subsetted for those detected at sufficient levels within each time point,
Identify clusters
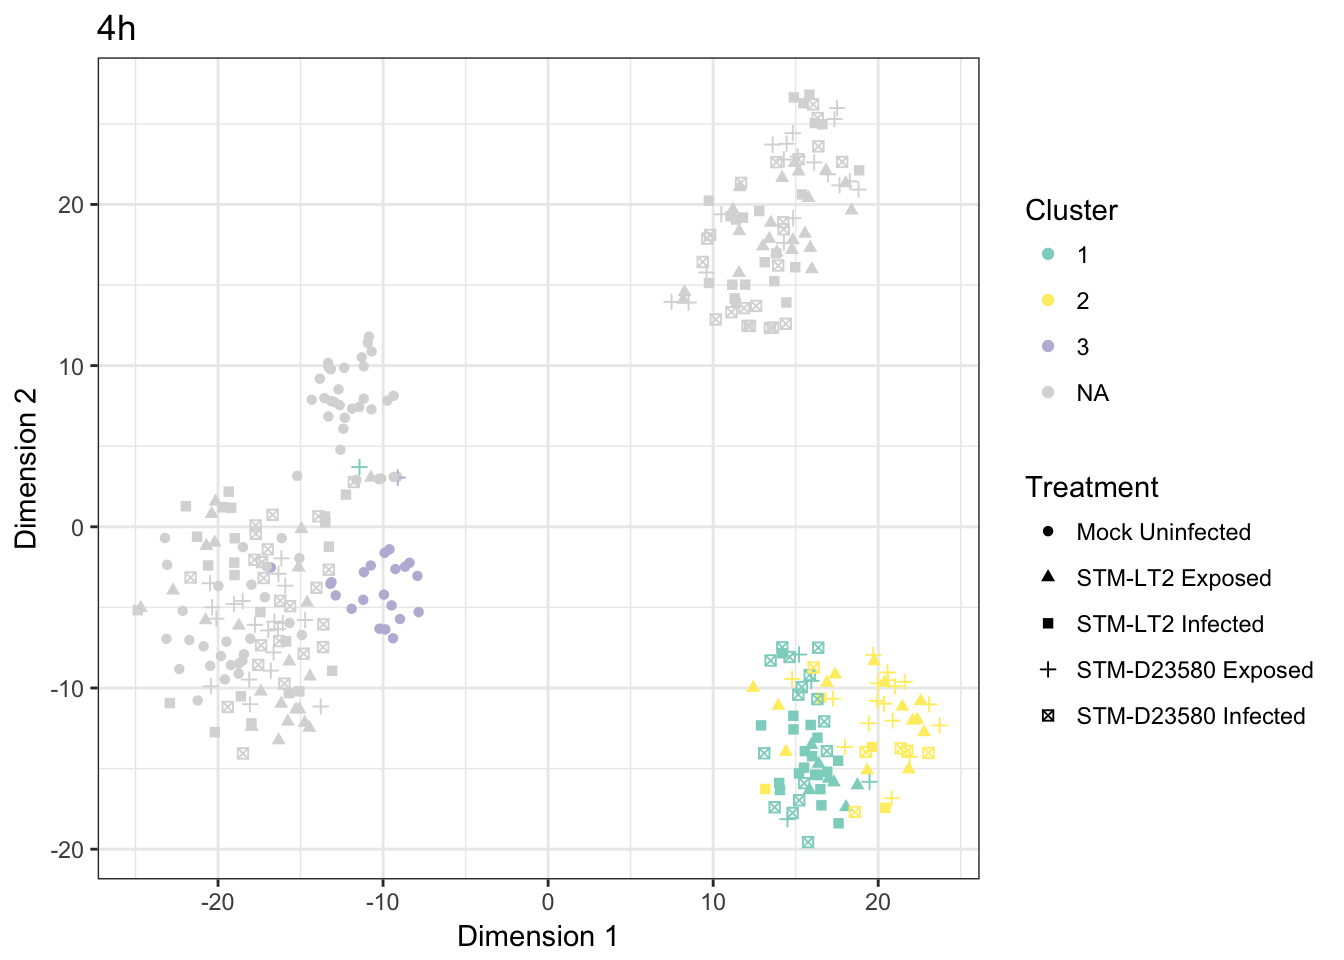
Let us carry out an unsupervised identification of clusters within each time point.
2h
clusters <- quickCluster(
  sce.2h, min.size=min(table(sce.2h$Treatment)),
  assay.type="counts")
## Warning in .quick_cluster(assay(x, i = assay.type), subset.row =
## subset.row, : 6 cells were not assigned to any clustersce.2h$quickCluster <- clusters
qc.2h <- rep(NA, ncol(sce.endo)); names(qc.2h) <- colnames(sce.endo)
qc.2h[colnames(sce.2h)] <- as.numeric(levels(clusters)[clusters])
sce.endo$quickCluster.2h <- as.factor(qc.2h)4h
clusters <- quickCluster(
  sce.4h, min.size=min(table(sce.4h$Treatment)),
  assay.type="counts")
sce.4h$quickCluster <- clusters
qc.4h <- rep(NA, ncol(sce.endo)); names(qc.4h) <- colnames(sce.endo)
qc.4h[colnames(sce.4h)] <- as.numeric(levels(clusters)[clusters])
sce.endo$quickCluster.4h <- as.factor(qc.4h)
6h
clusters <- quickCluster(
  sce.6h, min.size=min(table(sce.6h$Treatment)),
  assay.type="counts")
sce.6h$quickCluster <- clusters
qc.6h <- rep(NA, ncol(sce.endo)); names(qc.6h) <- colnames(sce.endo)
qc.6h[colnames(sce.6h)] <- as.numeric(levels(clusters)[clusters])
sce.endo$quickCluster.6h <- as.factor(qc.6h)
tSNE
Let us first define:
- a set of colours used to indicate cluster membership consistently across the upcoming sections:
col.cluster <- brewer.pal(12, "Set3")[c(1,12,3,4,9)]
names(col.cluster) <- c(1:3,0,"NA")
2h
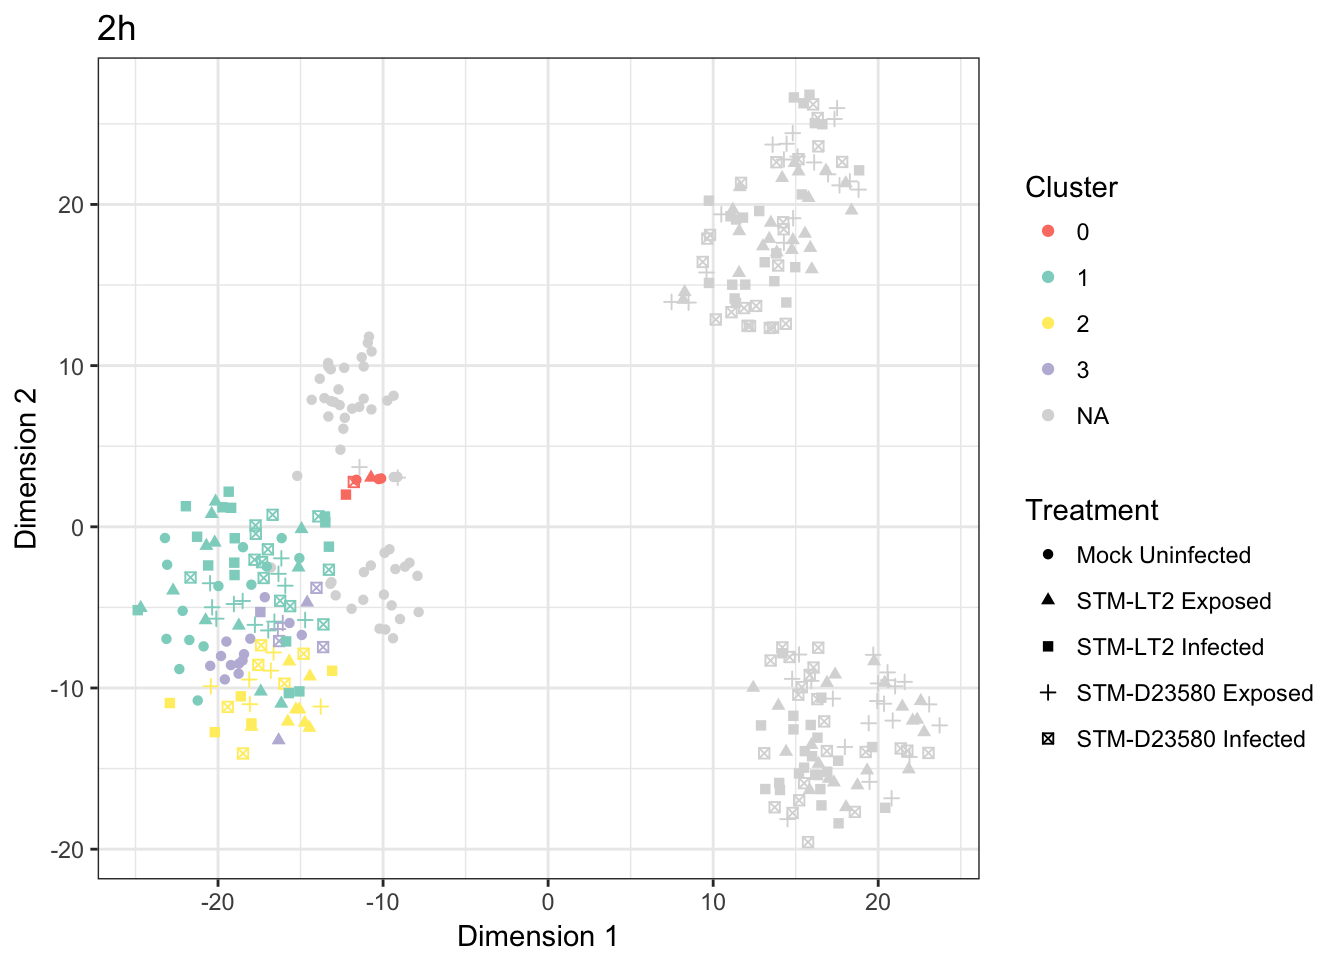
Cross-tabulated counts of cells by cluster and experimental treatment:
| 0 | 1 | 2 | 3 | |
|---|---|---|---|---|
| Mock Uninfected | 3 | 14 | 0 | 13 |
| STM-LT2 Exposed | 1 | 12 | 8 | 2 |
| STM-LT2 Infected | 1 | 16 | 5 | 1 |
| STM-D23580 Exposed | 0 | 12 | 6 | 2 |
| STM-D23580 Infected | 1 | 13 | 6 | 3 |
Visualised as a bar plot:
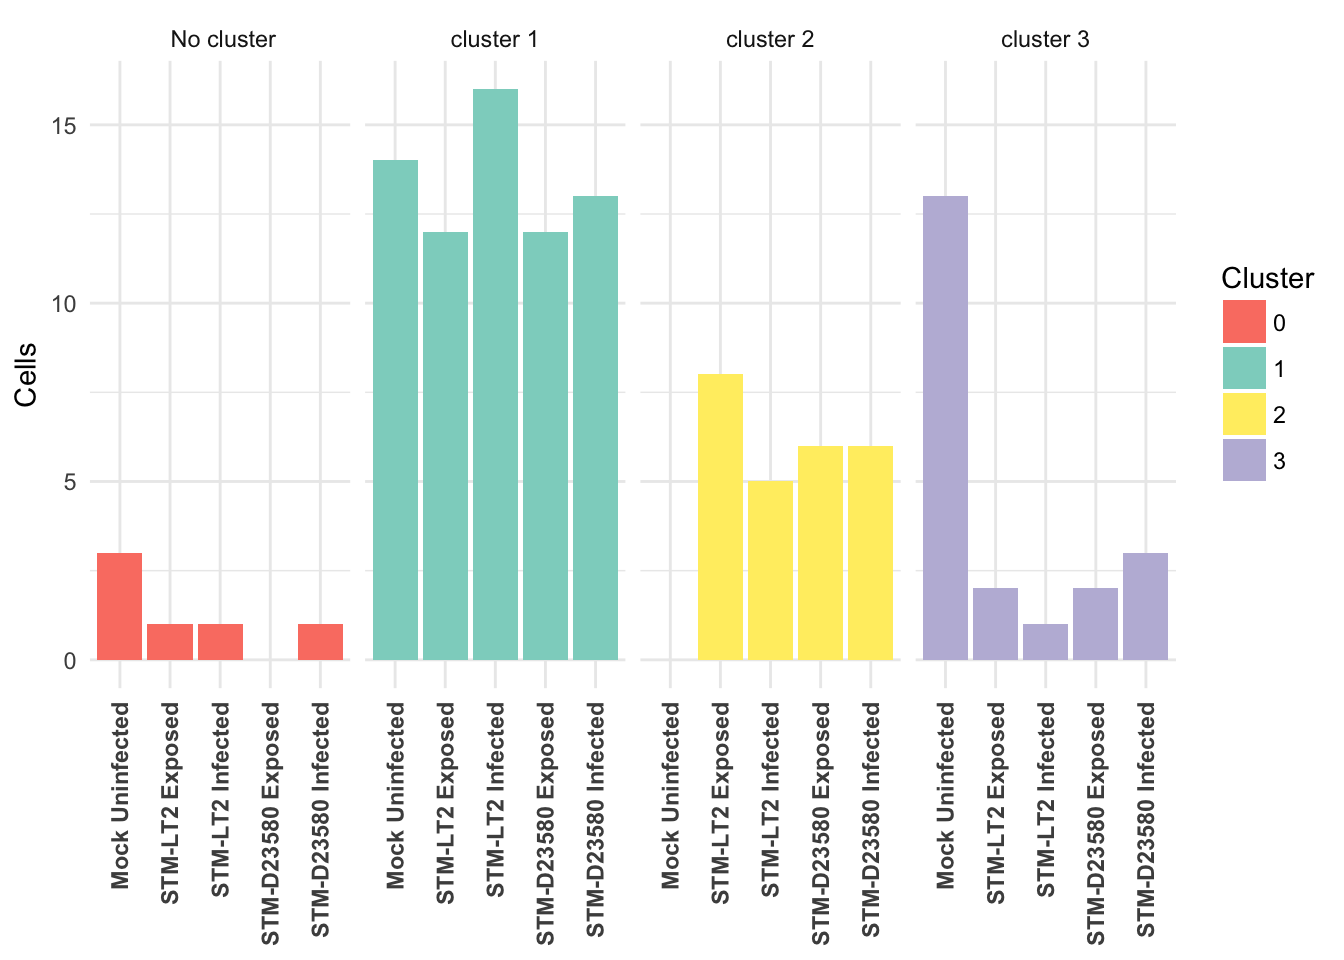
4h
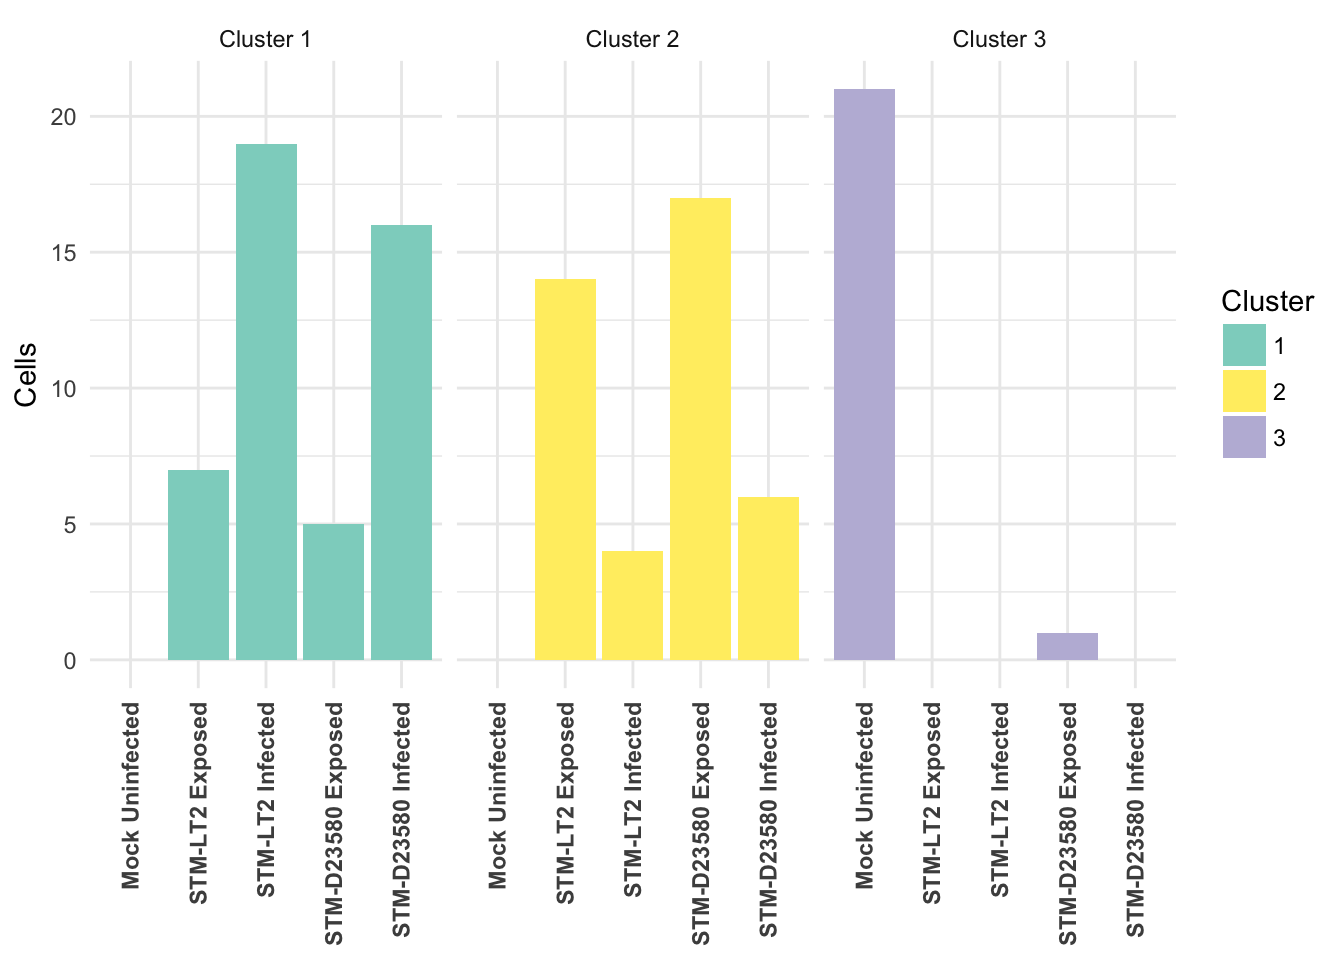
Cross-tabulated counts of cells by cluster and experimental treatment:
| 1 | 2 | 3 | |
|---|---|---|---|
| Mock Uninfected | 0 | 0 | 21 |
| STM-LT2 Exposed | 7 | 14 | 0 |
| STM-LT2 Infected | 19 | 4 | 0 |
| STM-D23580 Exposed | 5 | 17 | 1 |
| STM-D23580 Infected | 16 | 6 | 0 |
Visualised as a bar plot:
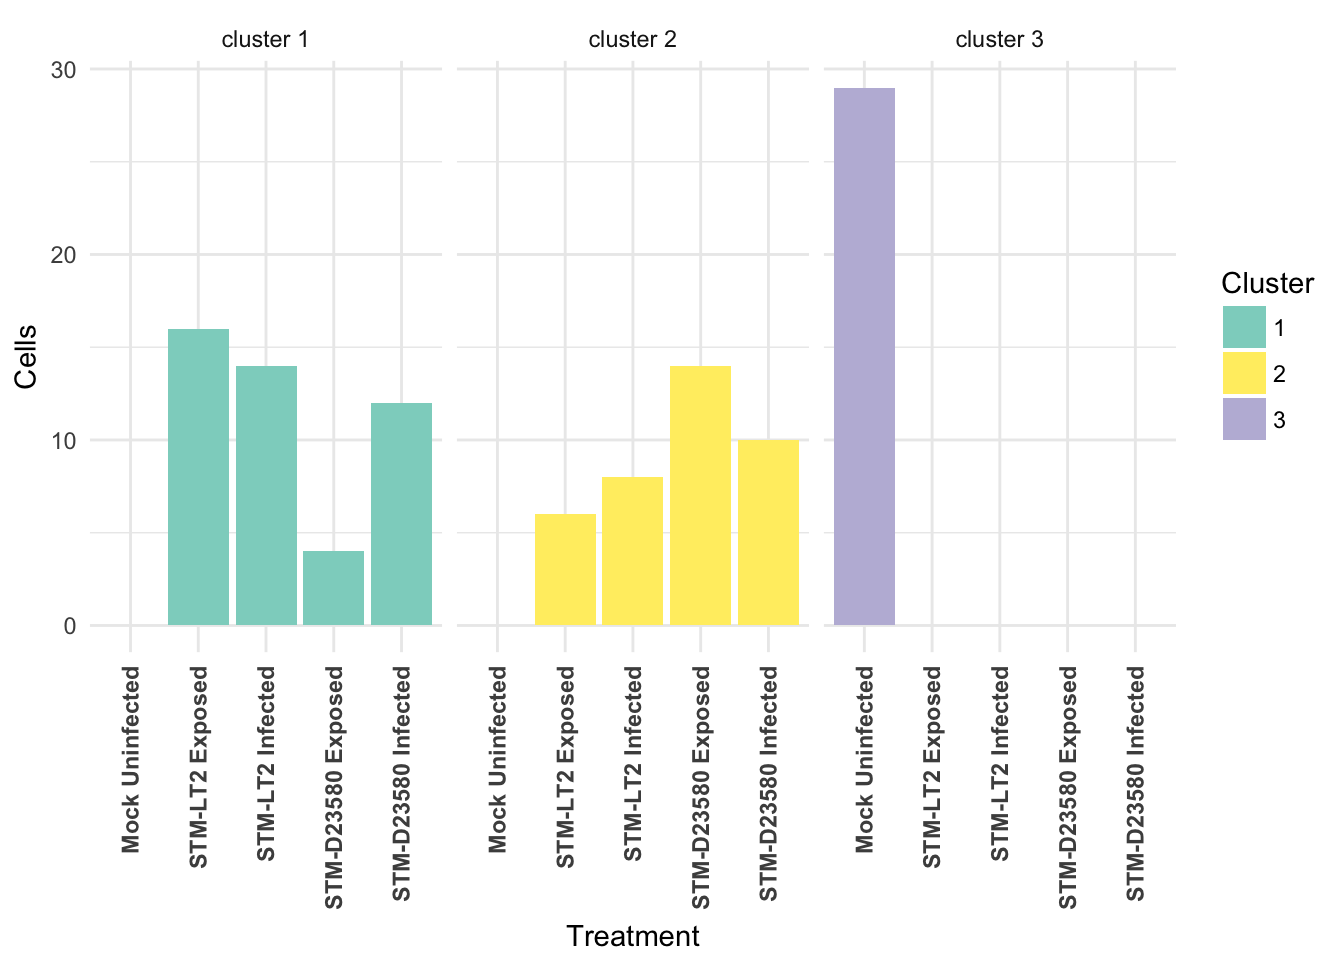
6h
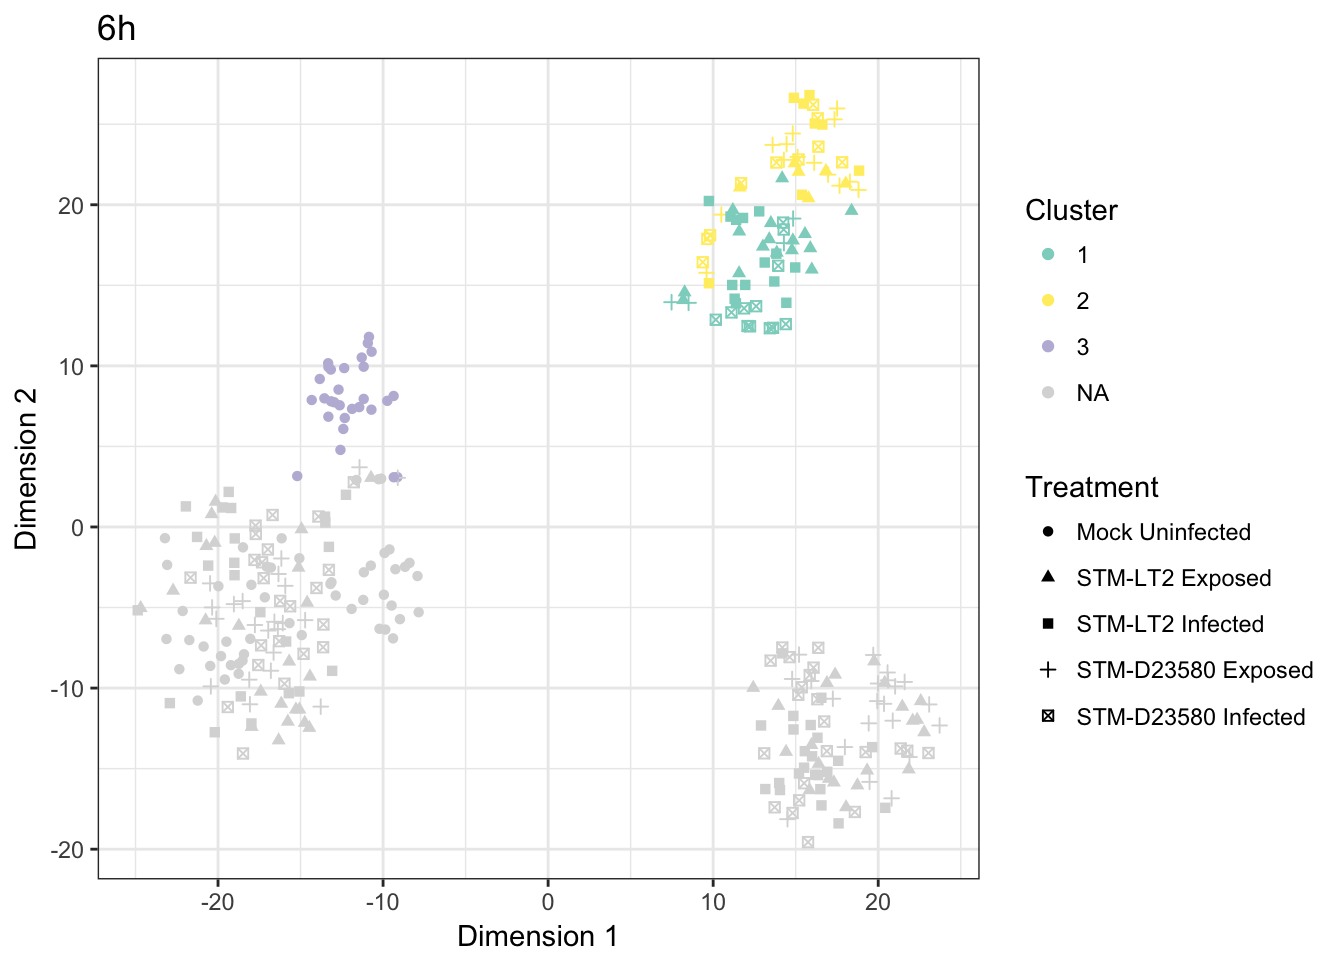
Cross-tabulated counts of cells by cluster and experimental treatment:
| 1 | 2 | 3 | |
|---|---|---|---|
| Mock Uninfected | 0 | 0 | 29 |
| STM-LT2 Exposed | 16 | 6 | 0 |
| STM-LT2 Infected | 14 | 8 | 0 |
| STM-D23580 Exposed | 4 | 14 | 0 |
| STM-D23580 Infected | 12 | 10 | 0 |
Visualised as a bar plot: