ERCC spike-in content
Objective
The input number of spike-in molecules per cell may be calculated as described in the BASiCS tutorial (./Material/TutorialBASiCS2016.html):
\[\begin{equation*} \mu_{i} = C_i \times 10^{-18} \times (6.022 \times 10^{23}) \times V \times D \hspace{0.5cm} \mbox{where,} \end{equation*}\]- \(C_i\) is the concentration of the spike \(i\) in the ERCC mix
- \(10^{-18}\) is to convert aM (attomolar) to M (molar)
- \(6.022 \times 10^{23}\) is the Avogadro number (molecules per mole)
- \(V\) is the volume added into each well, here \(10\mu{L}\)
- \(D\) is a dilution factor, here \(1:100,000,000\)
Concentrations in ERCC Mix from the manufacturer
Let us import the concentration of individual spike-in molecules from ThermoFisher:
mixC <- read.table(
  "expdata/cms_095046.txt", header = TRUE, sep = "\t",
  stringsAsFactors = FALSE
  )[,c("ERCC.ID","concentration.in.Mix.1..attomoles.ul.")]
rownames(mixC) <- mixC$ERCC.ID
colnames(mixC) <- c("ID","Concentration_attomoles_ul")
Number of individual ERCC molecules added to each cell
Let us calculate from the manufacturer’s information and our experimental protocol:
mixC$ERCCmolecules <-
mixC$Concentration_attomoles_ul *
10^-18 *
6.022 * 10^23 *
10 *
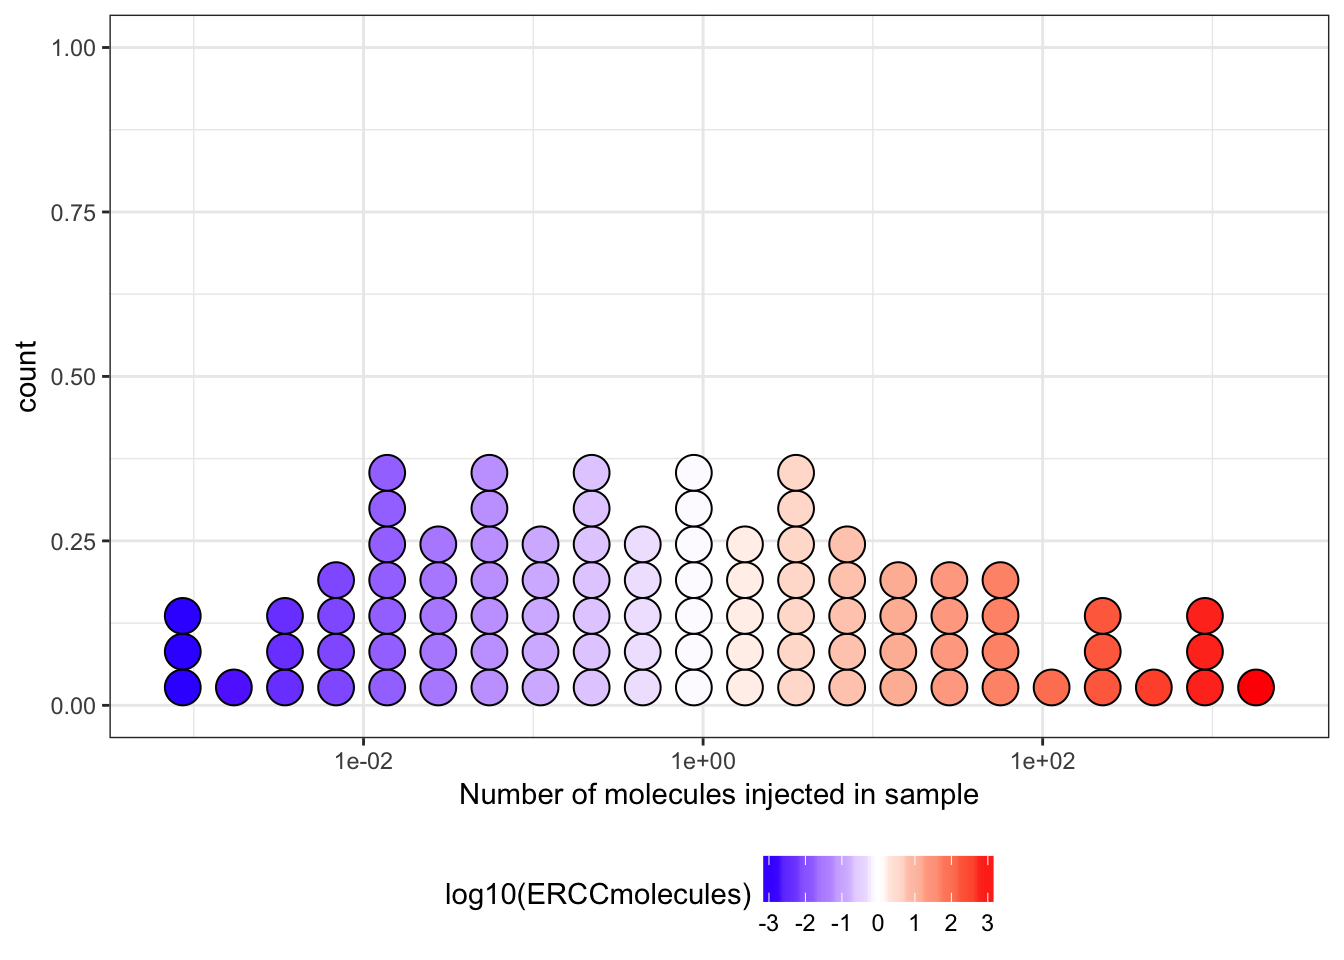
10^-8We may then display the expected count of ERCC Spike-In injected at various levels in each sample; vertical dashed lines indicate levels of 1, 10, 100, and 1,000 molecules:
We may also examine the count individual ERCC Spike-In expected above different thresholds of \(molecules / well\):
| log10(molecules) cutoff | ERCC features detected |
|---|---|
| 1 | 38 |
| 10 | 21 |
| 100 | 9 |
| 1000 | 1 |