Markers of clusters using scde
Preprocessed data
Note: for this analysis, the data is prepared identically to the differential expression between experimental groups using scde:
- ERCC spike-in features are removed,
- Cells in the data set is subsetted by time point,
- Genes in the data set are subsetted for those detected at sufficient levels within each time point,
- Error models are computed on the subsetted data sets
Differential expression
As a preliminary step to the identification of marker genes for each cluster, let us perform differential expression analysis between each cluster compared against the union of all other cells within that time point.
Setup
Let us first define a list to store the result tables returned by scde:
scde.res <- list()In addition, note that several functions defined in the first scde section will be re-used here.
2h
stopifnot(all(rownames(o.ifm.2h) == colnames(cd.ifm.2h)))
for (clusterId in levels(sce.ifm.2h$quickCluster.2h)){
  sg.test <- factor(
    sce.ifm.2h$quickCluster.2h == clusterId,
    levels = c(TRUE, FALSE),
    labels = c(clusterId, "Others"))
  names(sg.test) <- colnames(sce.ifm.2h); summary(sg.test)
  contrastName <- sprintf("2h_cluster%s-Others", clusterId);message(contrastName)
  scde.res[[contrastName]] <- scde.expression.difference(
      o.ifm.2h, cd.ifm.2h, o.prior.2h, sg.test, n.cores = 4, verbose = 1
    )
}
## 2h_cluster0-Others## comparing groups:
##
## 0 Others
## 6 113
## calculating difference posterior
## summarizing differences## 2h_cluster1-Others## comparing groups:
##
## 1 Others
## 67 52
## calculating difference posterior
## summarizing differences## 2h_cluster2-Others## comparing groups:
##
## 2 Others
## 25 94
## calculating difference posterior
## summarizing differences## 2h_cluster3-Others## comparing groups:
##
## 3 Others
## 21 98
## calculating difference posterior
## summarizing differences4h
stopifnot(all(rownames(o.ifm.4h) == colnames(cd.ifm.4h)))
for (clusterId in levels(sce.ifm.4h$quickCluster.4h)){
  sg.test <- factor(
    sce.ifm.4h$quickCluster.4h == clusterId,
    levels = c(TRUE, FALSE),
    labels = c(clusterId, "Others"))
  names(sg.test) <- colnames(sce.ifm.4h); summary(sg.test)
  contrastName <- sprintf("4h_cluster%s-Others", clusterId);message(contrastName)
  scde.res[[contrastName]] <- scde.expression.difference(
      o.ifm.4h, cd.ifm.4h, o.prior.4h, sg.test, n.cores = 4, verbose = 1
    )
}
## 4h_cluster1-Others## comparing groups:
##
## 1 Others
## 47 63
## calculating difference posterior
## summarizing differences## 4h_cluster2-Others## comparing groups:
##
## 2 Others
## 41 69
## calculating difference posterior
## summarizing differences## 4h_cluster3-Others## comparing groups:
##
## 3 Others
## 22 88
## calculating difference posterior
## summarizing differences6h
stopifnot(all(rownames(o.ifm.6h) == colnames(cd.ifm.6h)))
for (clusterId in levels(sce.ifm.6h$quickCluster.6h)){
  sg.test <- factor(
    sce.ifm.6h$quickCluster.6h == clusterId,
    levels = c(TRUE, FALSE),
    labels = c(clusterId, "Others"))
  names(sg.test) <- colnames(sce.ifm.6h); summary(sg.test)
  contrastName <- sprintf("6h_cluster%s-Others", clusterId);message(contrastName)
  scde.res[[contrastName]] <- scde.expression.difference(
      o.ifm.6h, cd.ifm.6h, o.prior.6h, sg.test, n.cores = 4, verbose = 1
    )
}
## 6h_cluster1-Others## comparing groups:
##
## 1 Others
## 46 67
## calculating difference posterior
## summarizing differences## 6h_cluster2-Others## comparing groups:
##
## 2 Others
## 38 75
## calculating difference posterior
## summarizing differences## 6h_cluster3-Others## comparing groups:
##
## 3 Others
## 29 84
## calculating difference posterior
## summarizing differencesTop 50 markers by fold-change
Identification
For each time point, let us identify up to 50 gene markers for each cluster, and trace the respective cluster for which each gene is a marker, selected as follows:
- P-value less than 0.01
- mle of log fold-change among the 50 largest positive values for a cluster
Note: a gene may be identified as a marker for more than one cluster.
2h
markers_2h_FC <- character()
markers_2h_FC.cluster <- factor(NULL, levels(sce.ifm.2h$quickCluster.2h))
c2h <- grep("^2h", names(scde.res), value = TRUE)
for (contrastName in c2h){
  clusterId <- gsub("2h_cluster(.)-Others", "\\1", contrastName)
  scde.table <- addGeneName(convert.z.score(scde.res[[contrastName]]))
  scde.table <- subset(scde.table, mle > 0 & p.value < 0.01)
  scde.table <- scde.table[order(scde.table$mle, decreasing = TRUE),]
  scde.markers <- head(rownames(scde.table), 50)
  markers_2h_FC <- c(markers_2h_FC, scde.markers)
  markers_2h_FC.cluster <-
    c(markers_2h_FC.cluster, rep(clusterId, length(scde.markers)))
}
4h
markers_4h_FC <- character()
markers_4h_FC.cluster <- factor(NULL, levels(sce.ifm.4h$quickCluster.4h))
c4h <- grep("^4h", names(scde.res), value = TRUE)
for (contrastName in c4h){
  clusterId <- gsub("4h_cluster(.)-Others", "\\1", contrastName)
  scde.table <- addGeneName(convert.z.score(scde.res[[contrastName]]))
  scde.table <- subset(scde.table, mle > 0 & p.value < 0.01)
  scde.table <- scde.table[order(scde.table$mle, decreasing = TRUE),]
  scde.markers <- head(rownames(scde.table), 50)
  markers_4h_FC <- c(markers_4h_FC, scde.markers)
  markers_4h_FC.cluster <-
    c(markers_4h_FC.cluster, rep(clusterId, length(scde.markers)))
}
6h
markers_6h_FC <- character()
markers_6h_FC.cluster <- factor(NULL, levels(sce.ifm.6h$quickCluster.6h))
c6h <- grep("^6h", names(scde.res), value = TRUE)
for (contrastName in c6h){
clusterId <- gsub("6h_cluster(.)-Others", "\\1", contrastName)
scde.table <- addGeneName(convert.z.score(scde.res[[contrastName]]))
scde.table <- subset(scde.table, mle > 0 & p.value < 0.01)
scde.table <- scde.table[order(scde.table$mle, decreasing = TRUE),]
scde.markers <- head(rownames(scde.table), 50)
markers_6h_FC <- c(markers_6h_FC, scde.markers)
markers_6h_FC.cluster <-
c(markers_6h_FC.cluster, rep(clusterId, length(scde.markers)))
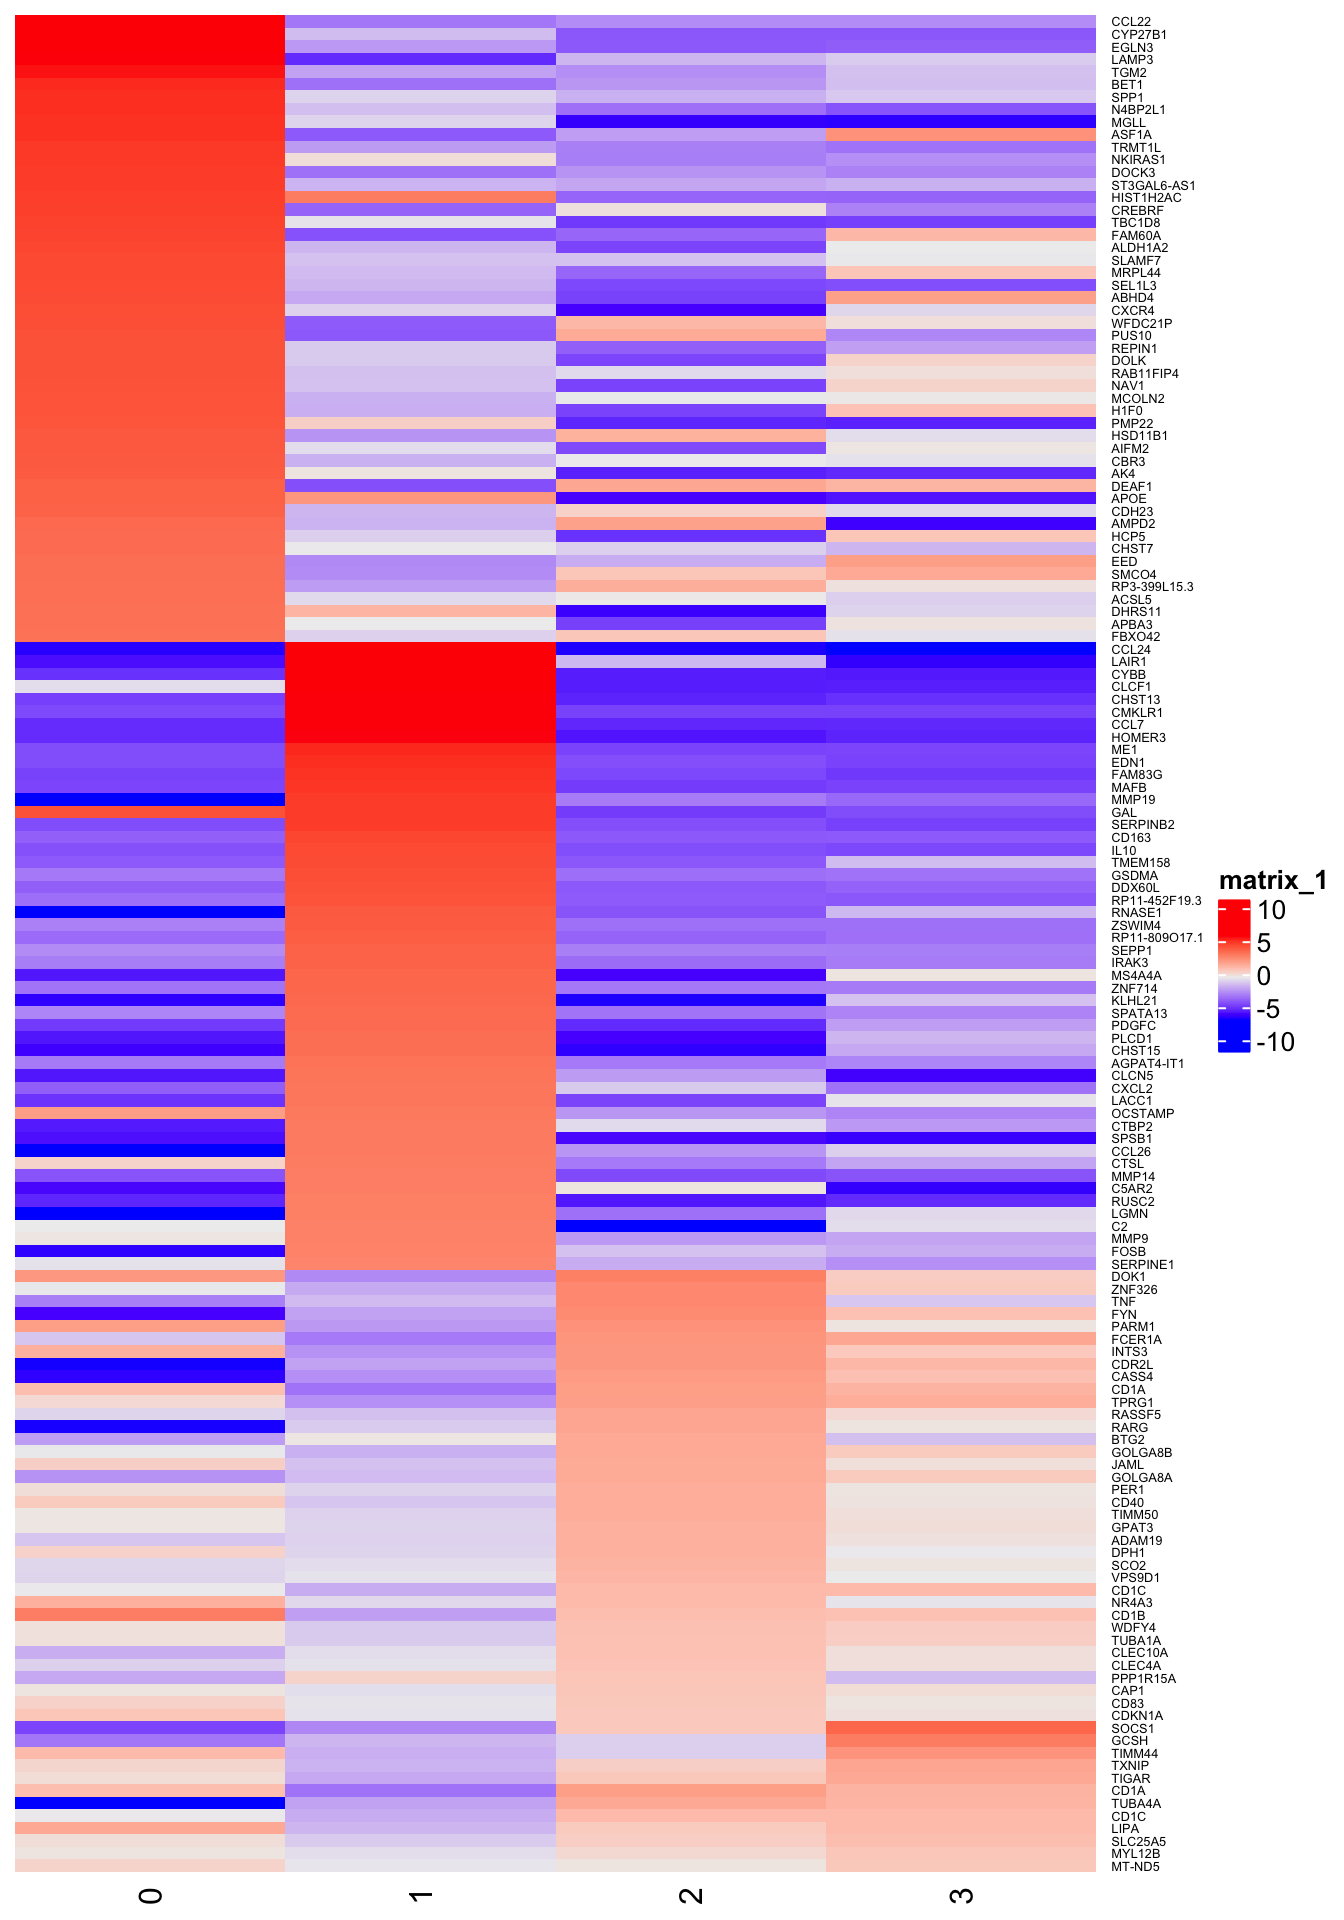
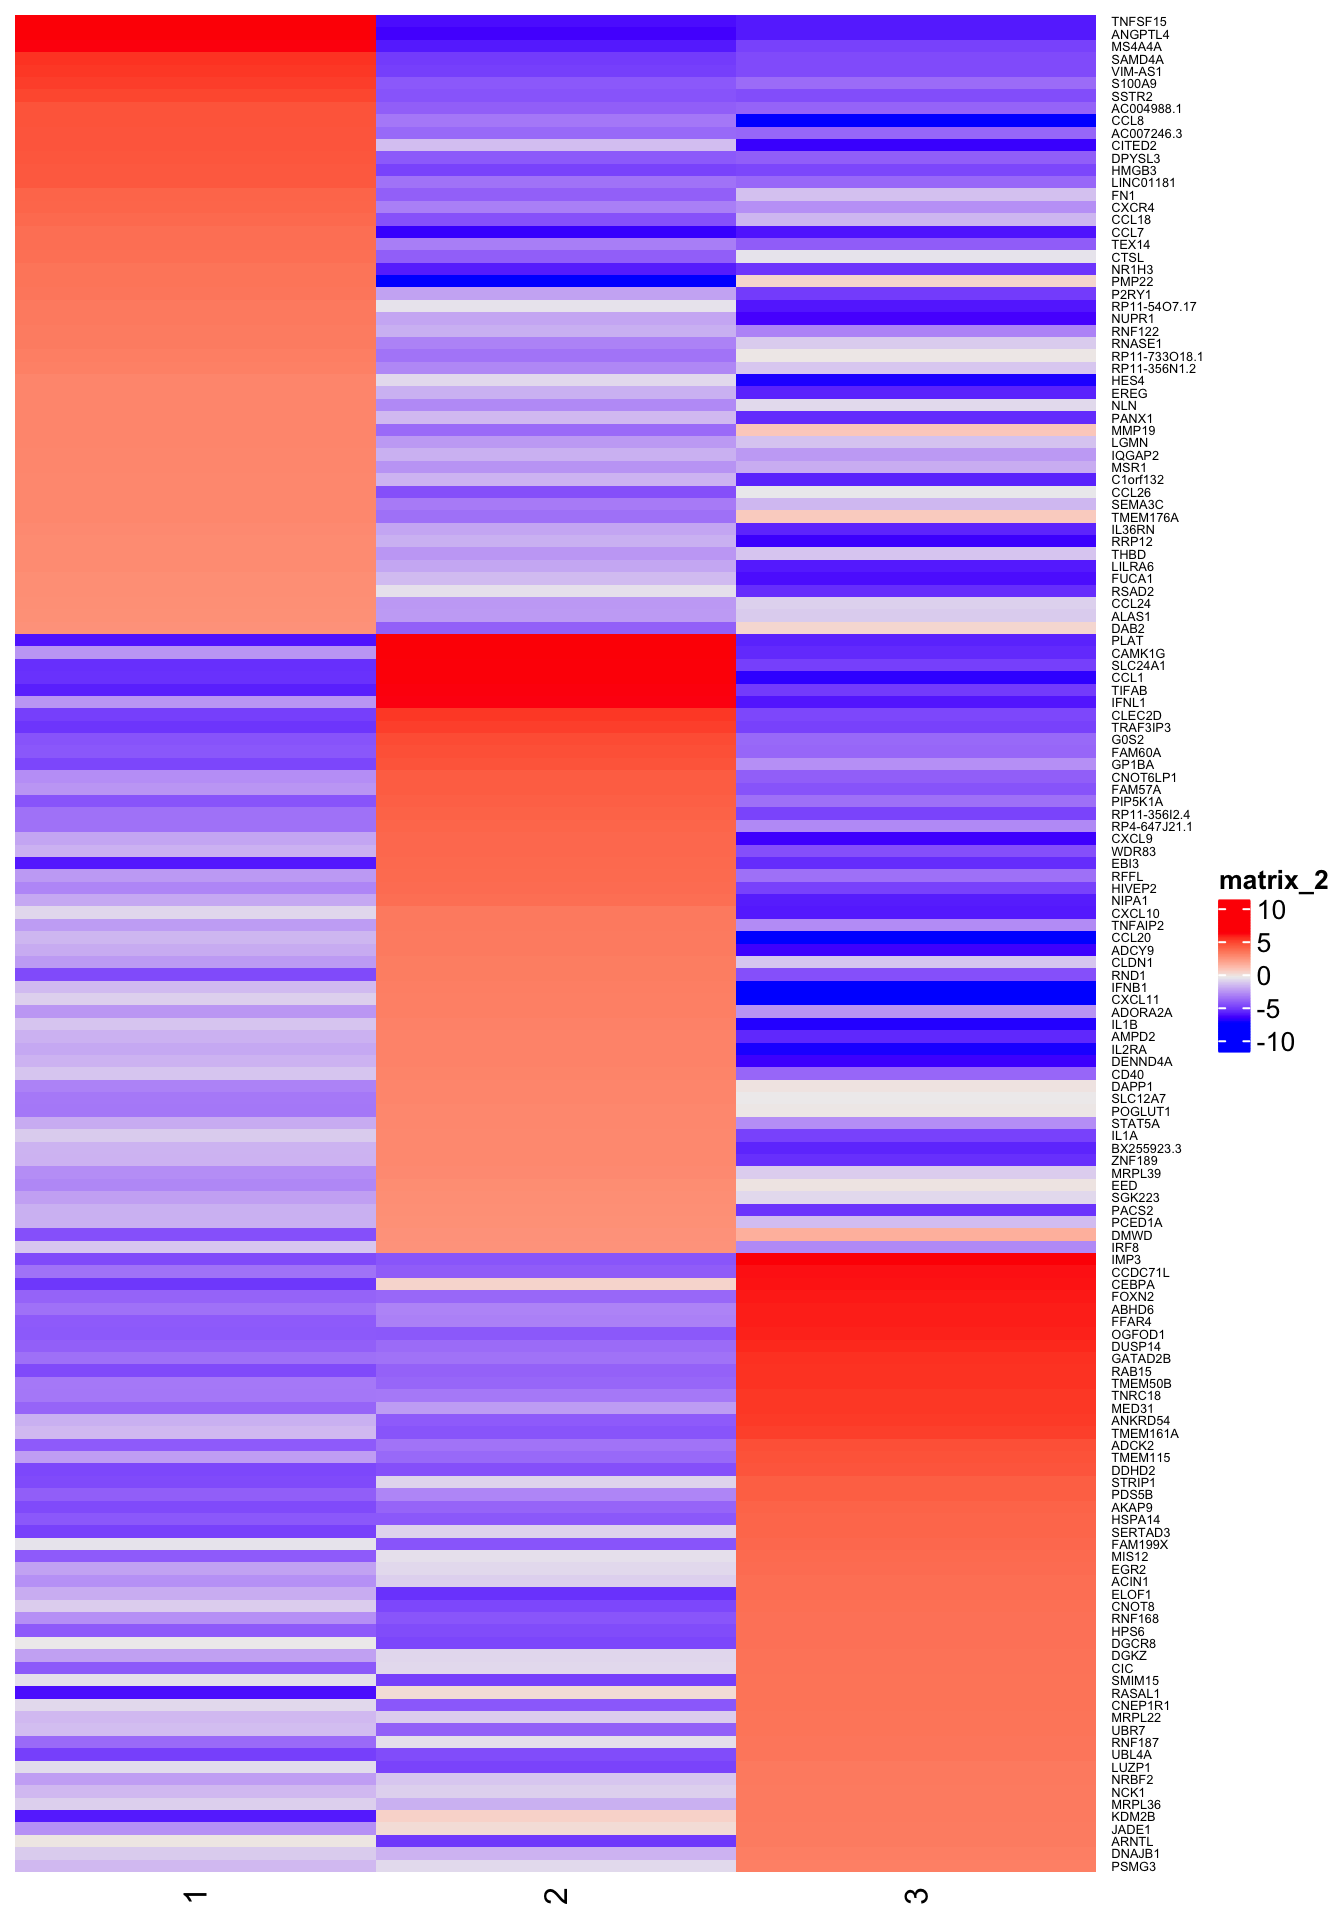
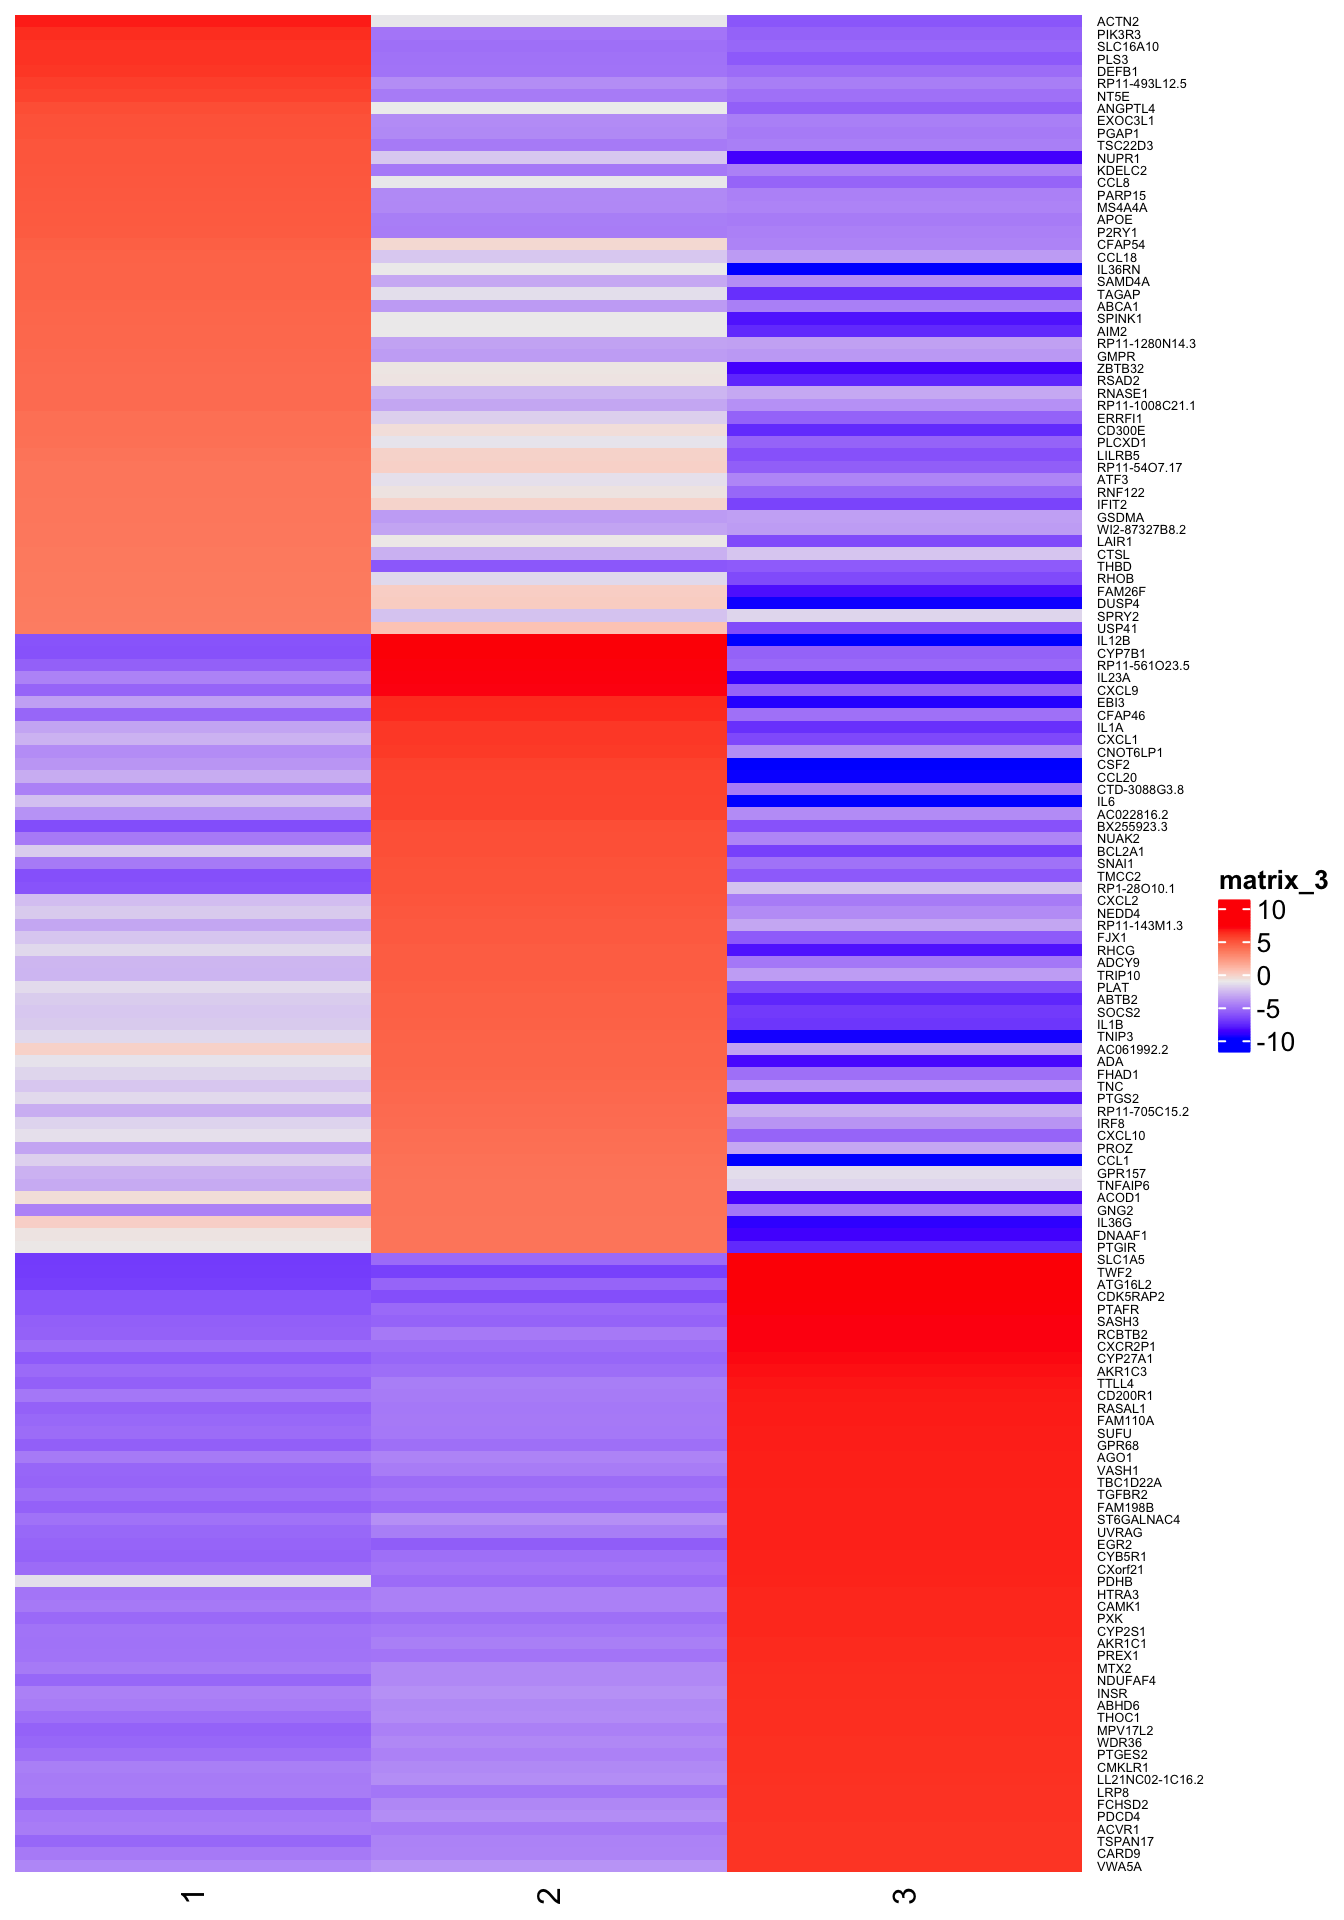
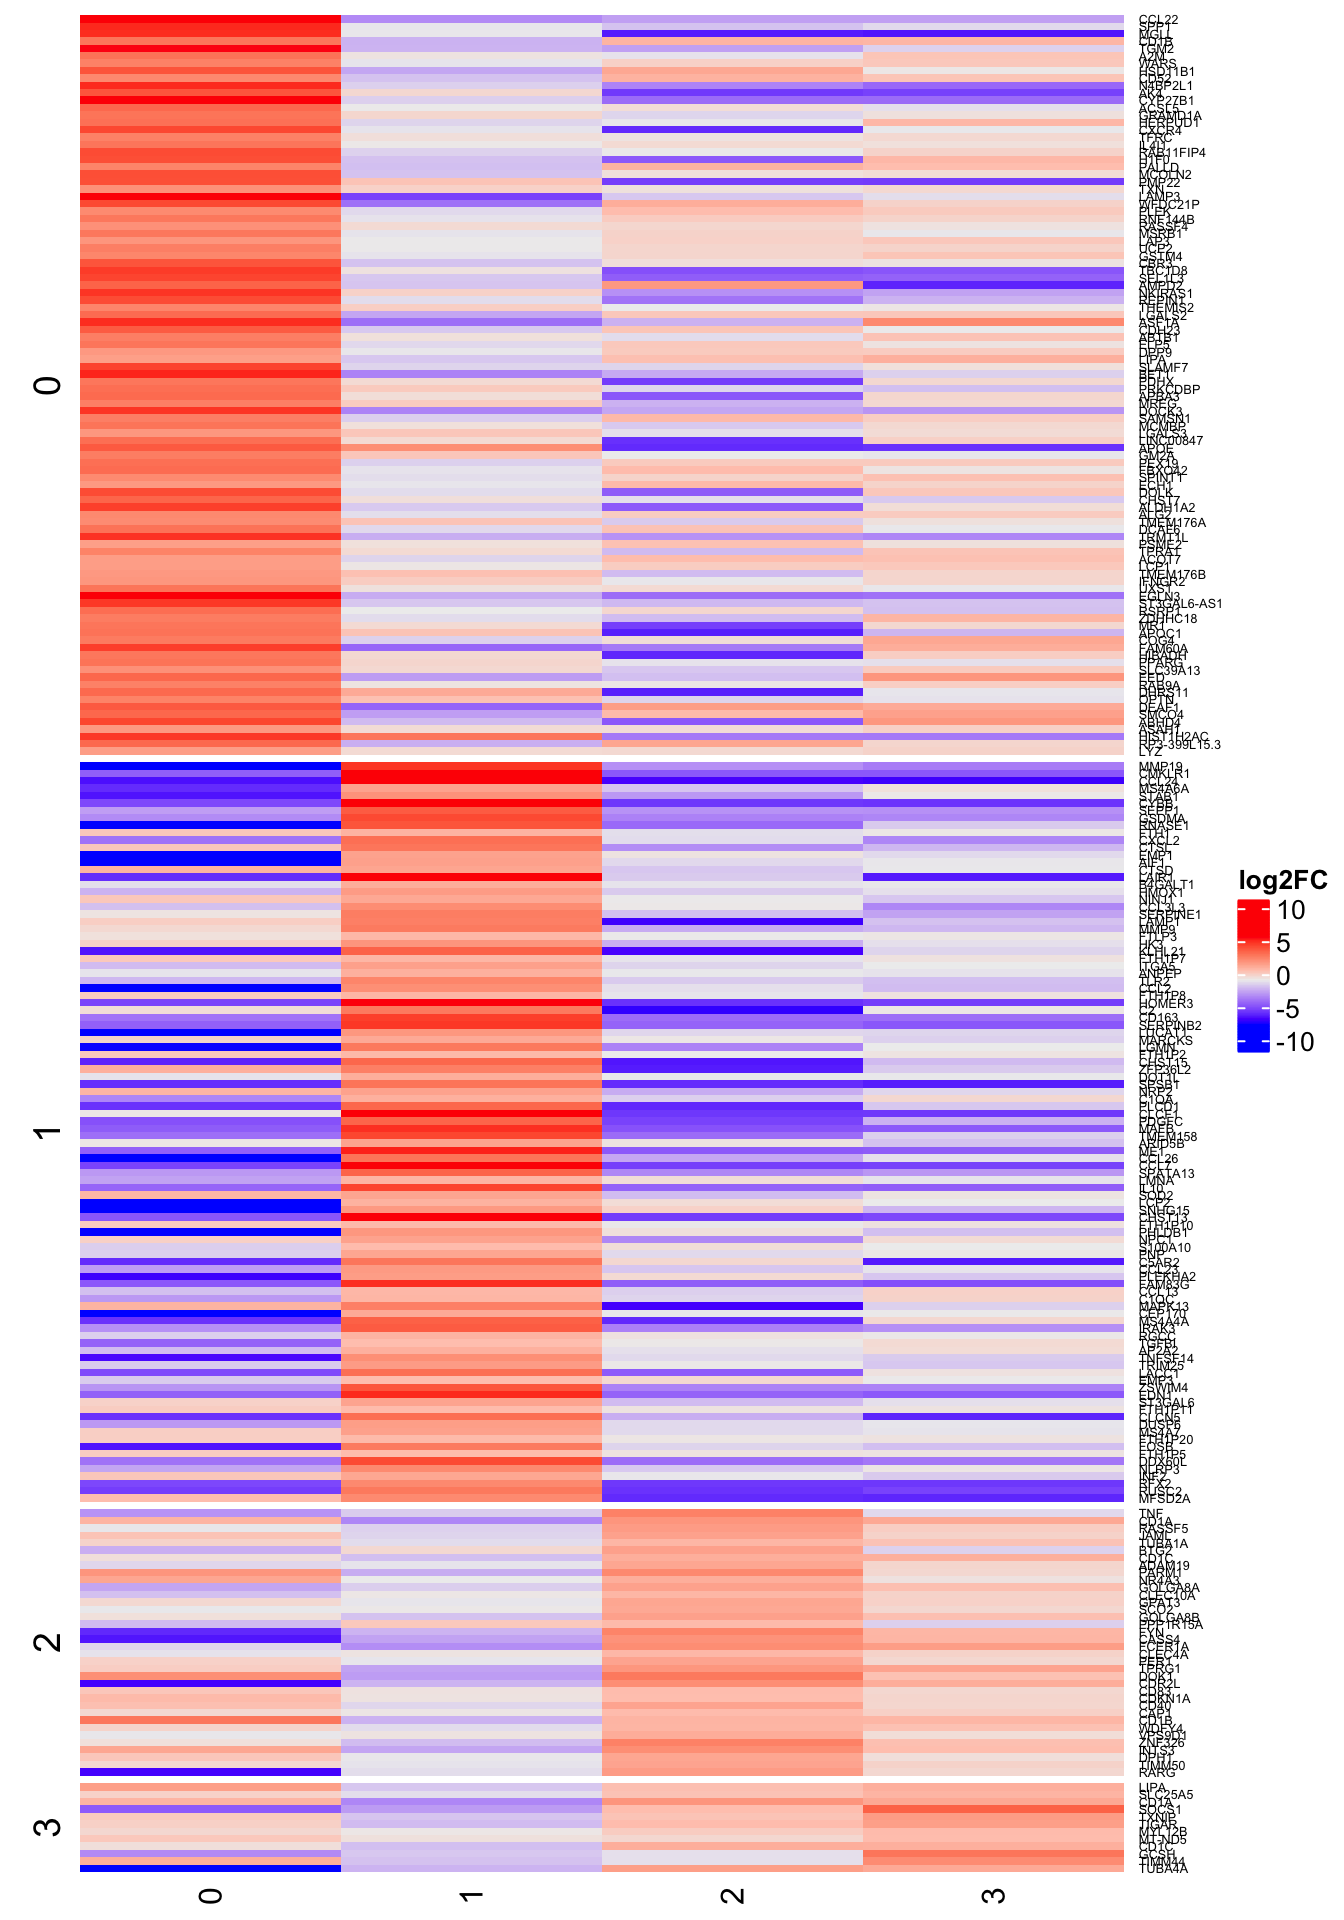
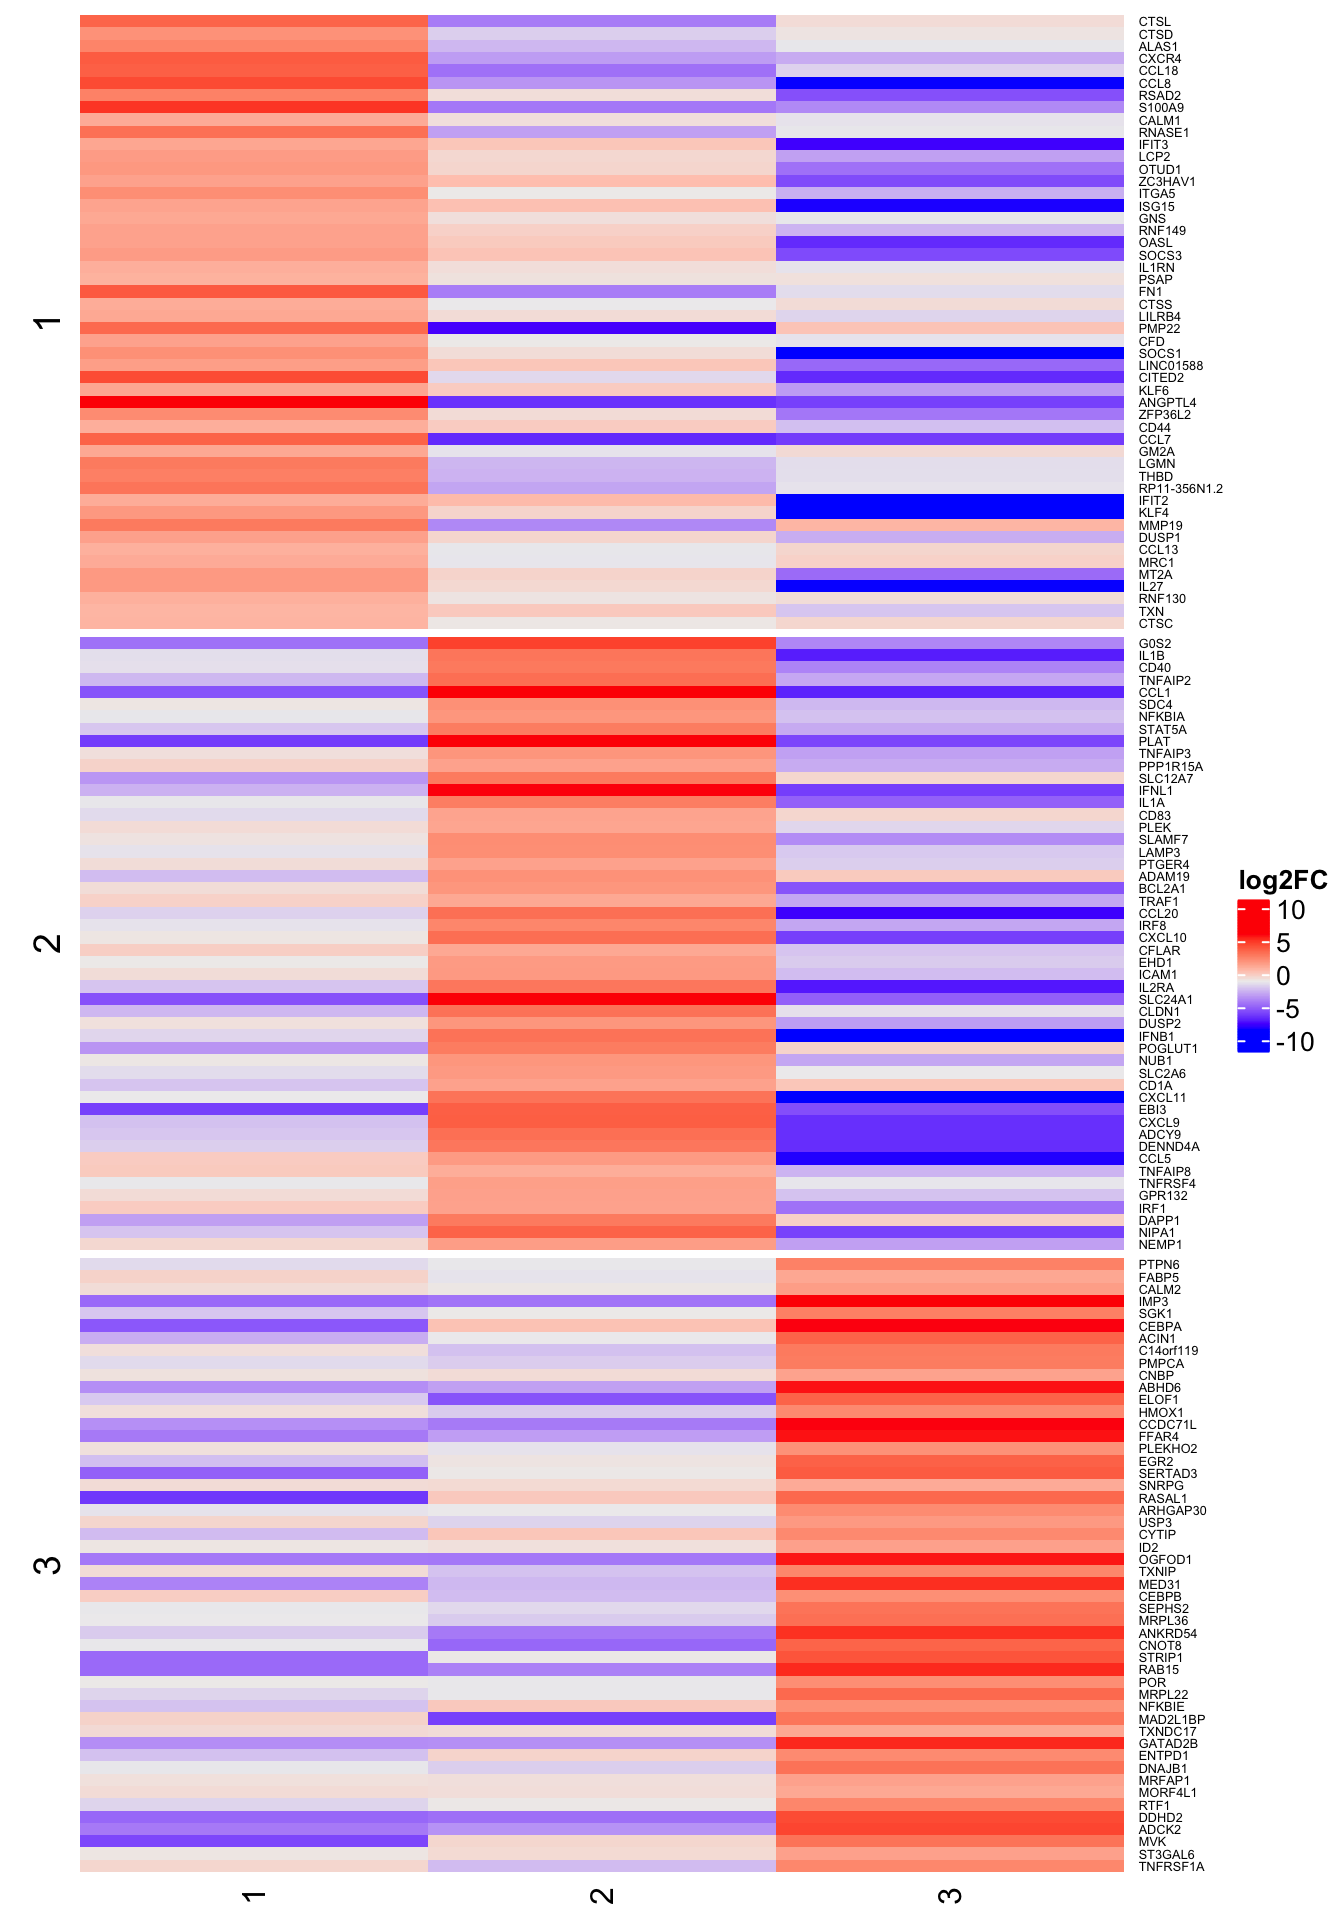
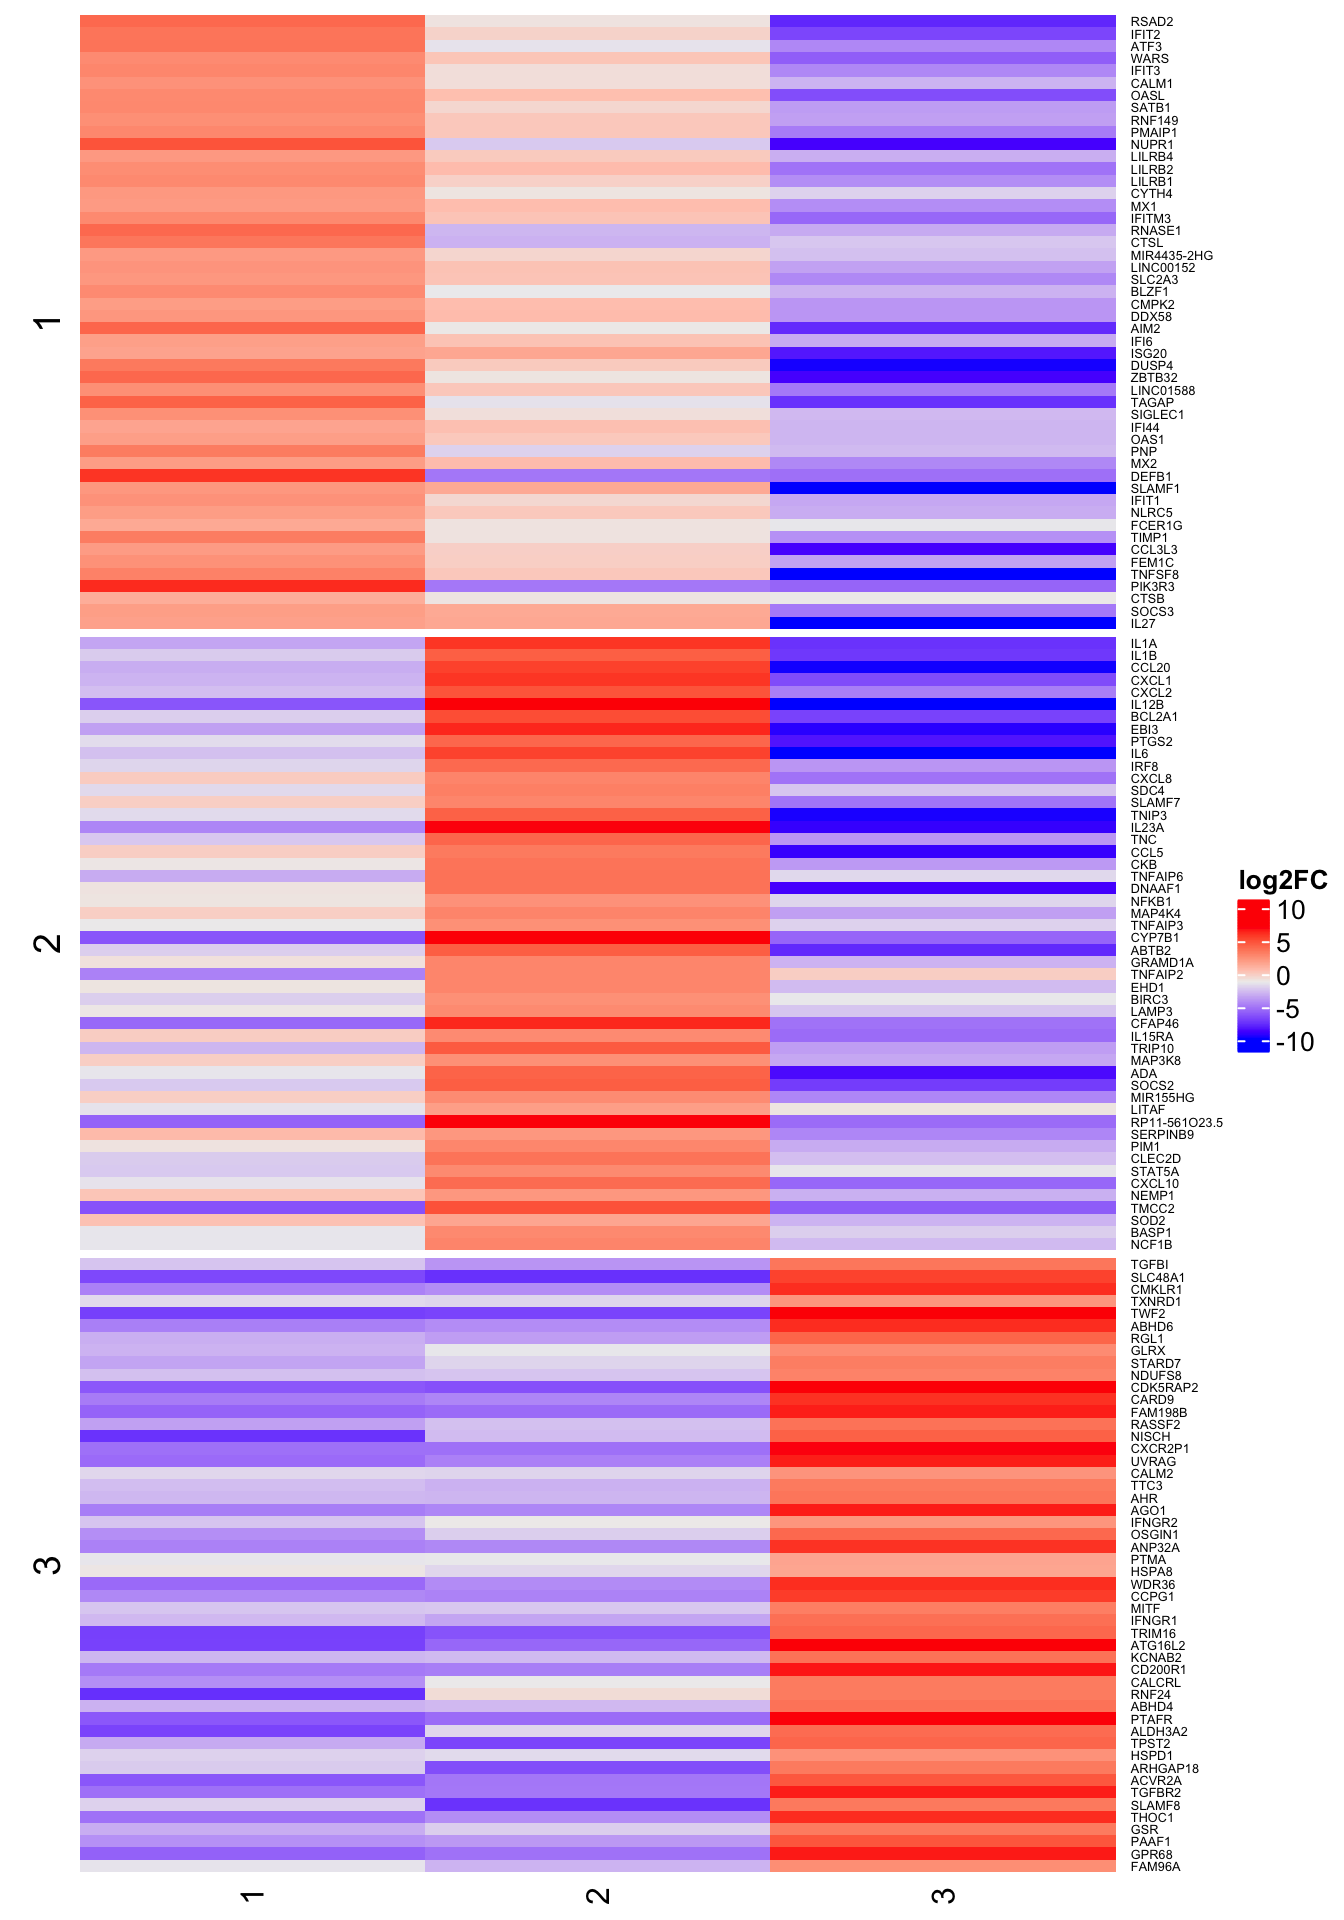
}Heat map of fold-change for (up to) 50 markers
2h
4h
6h
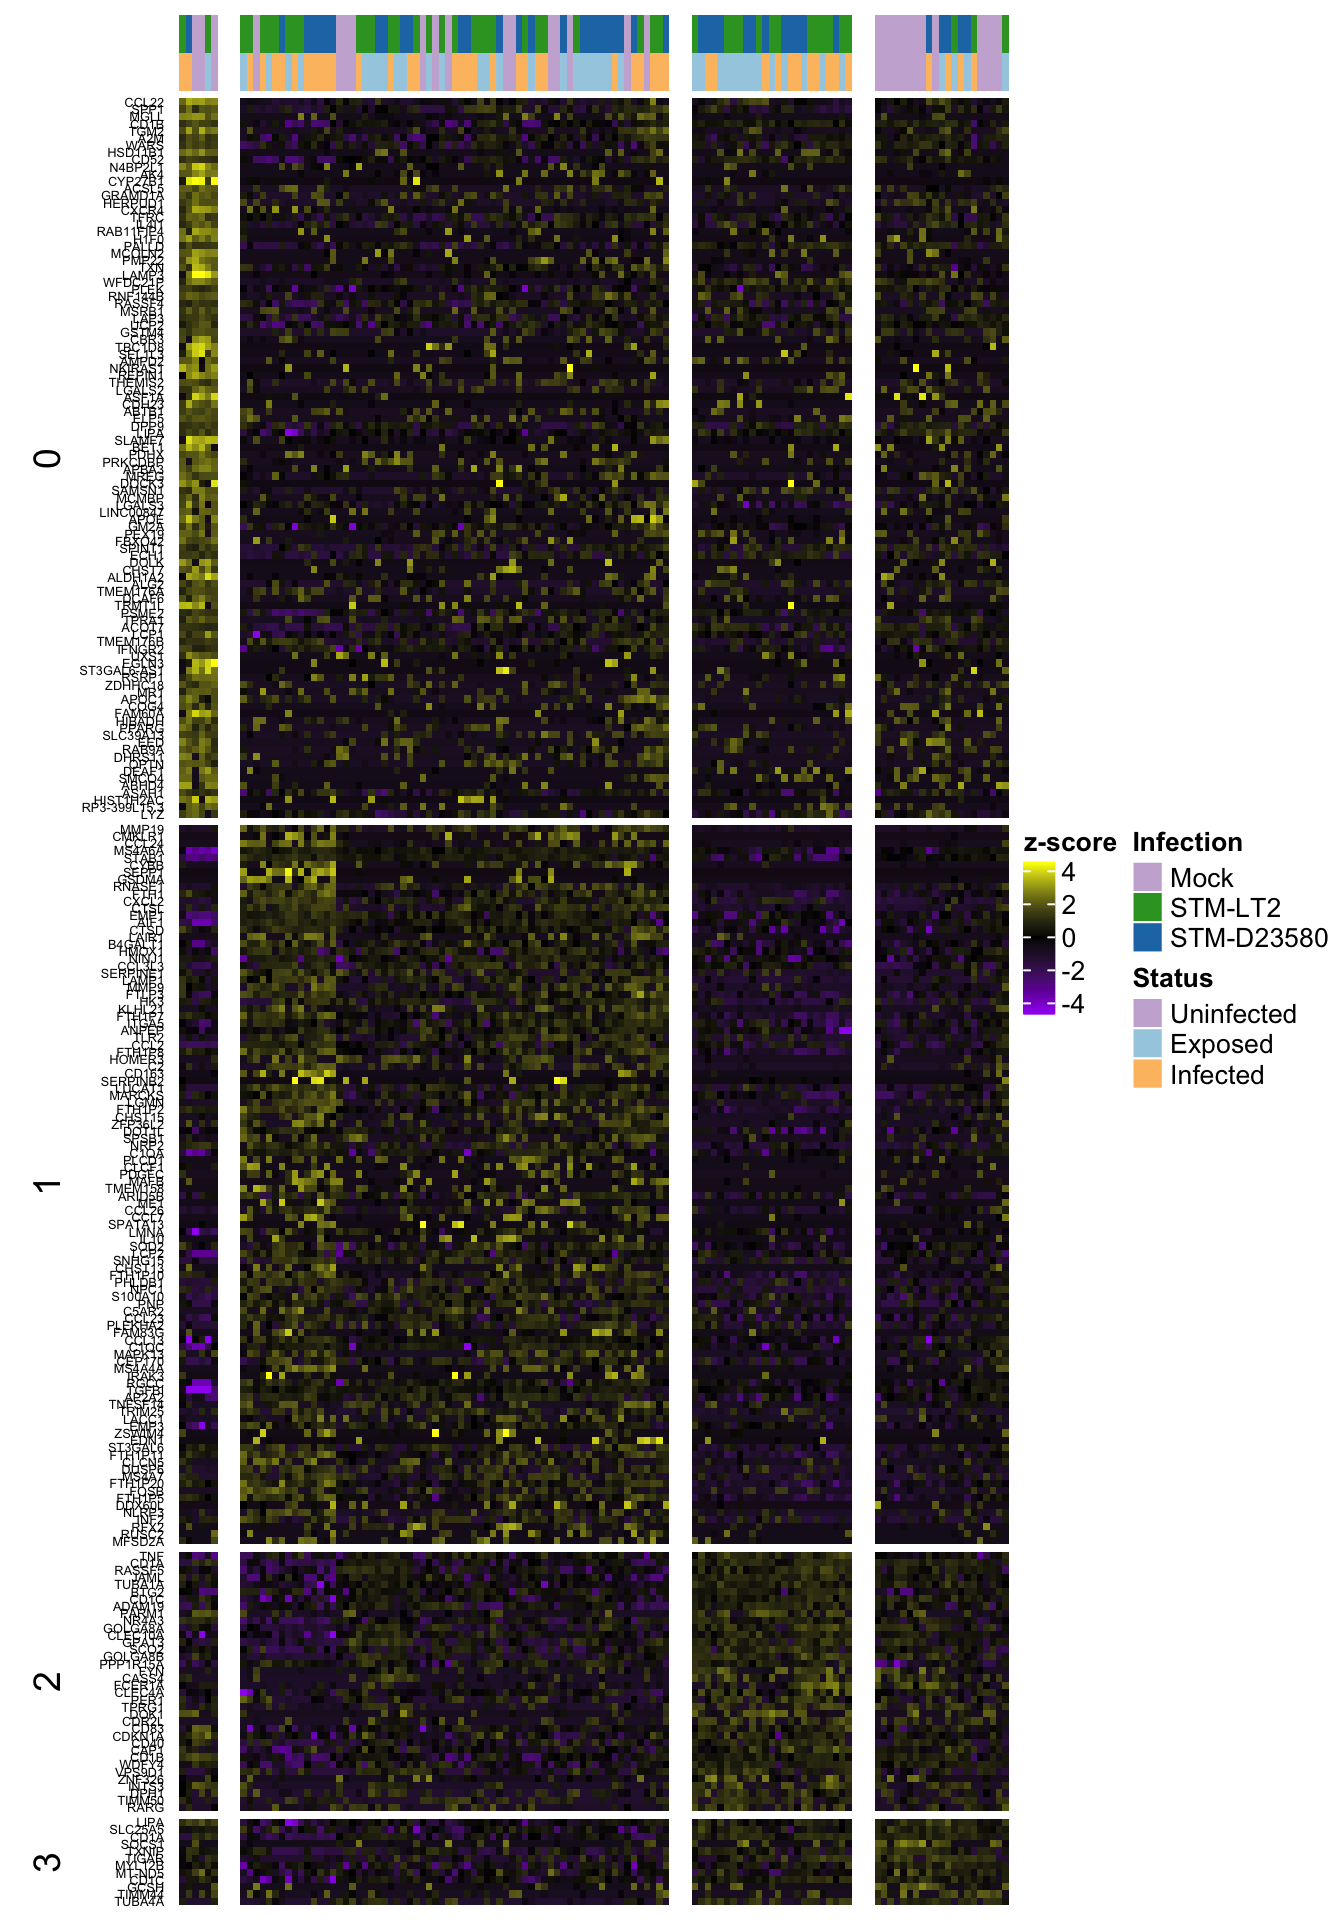
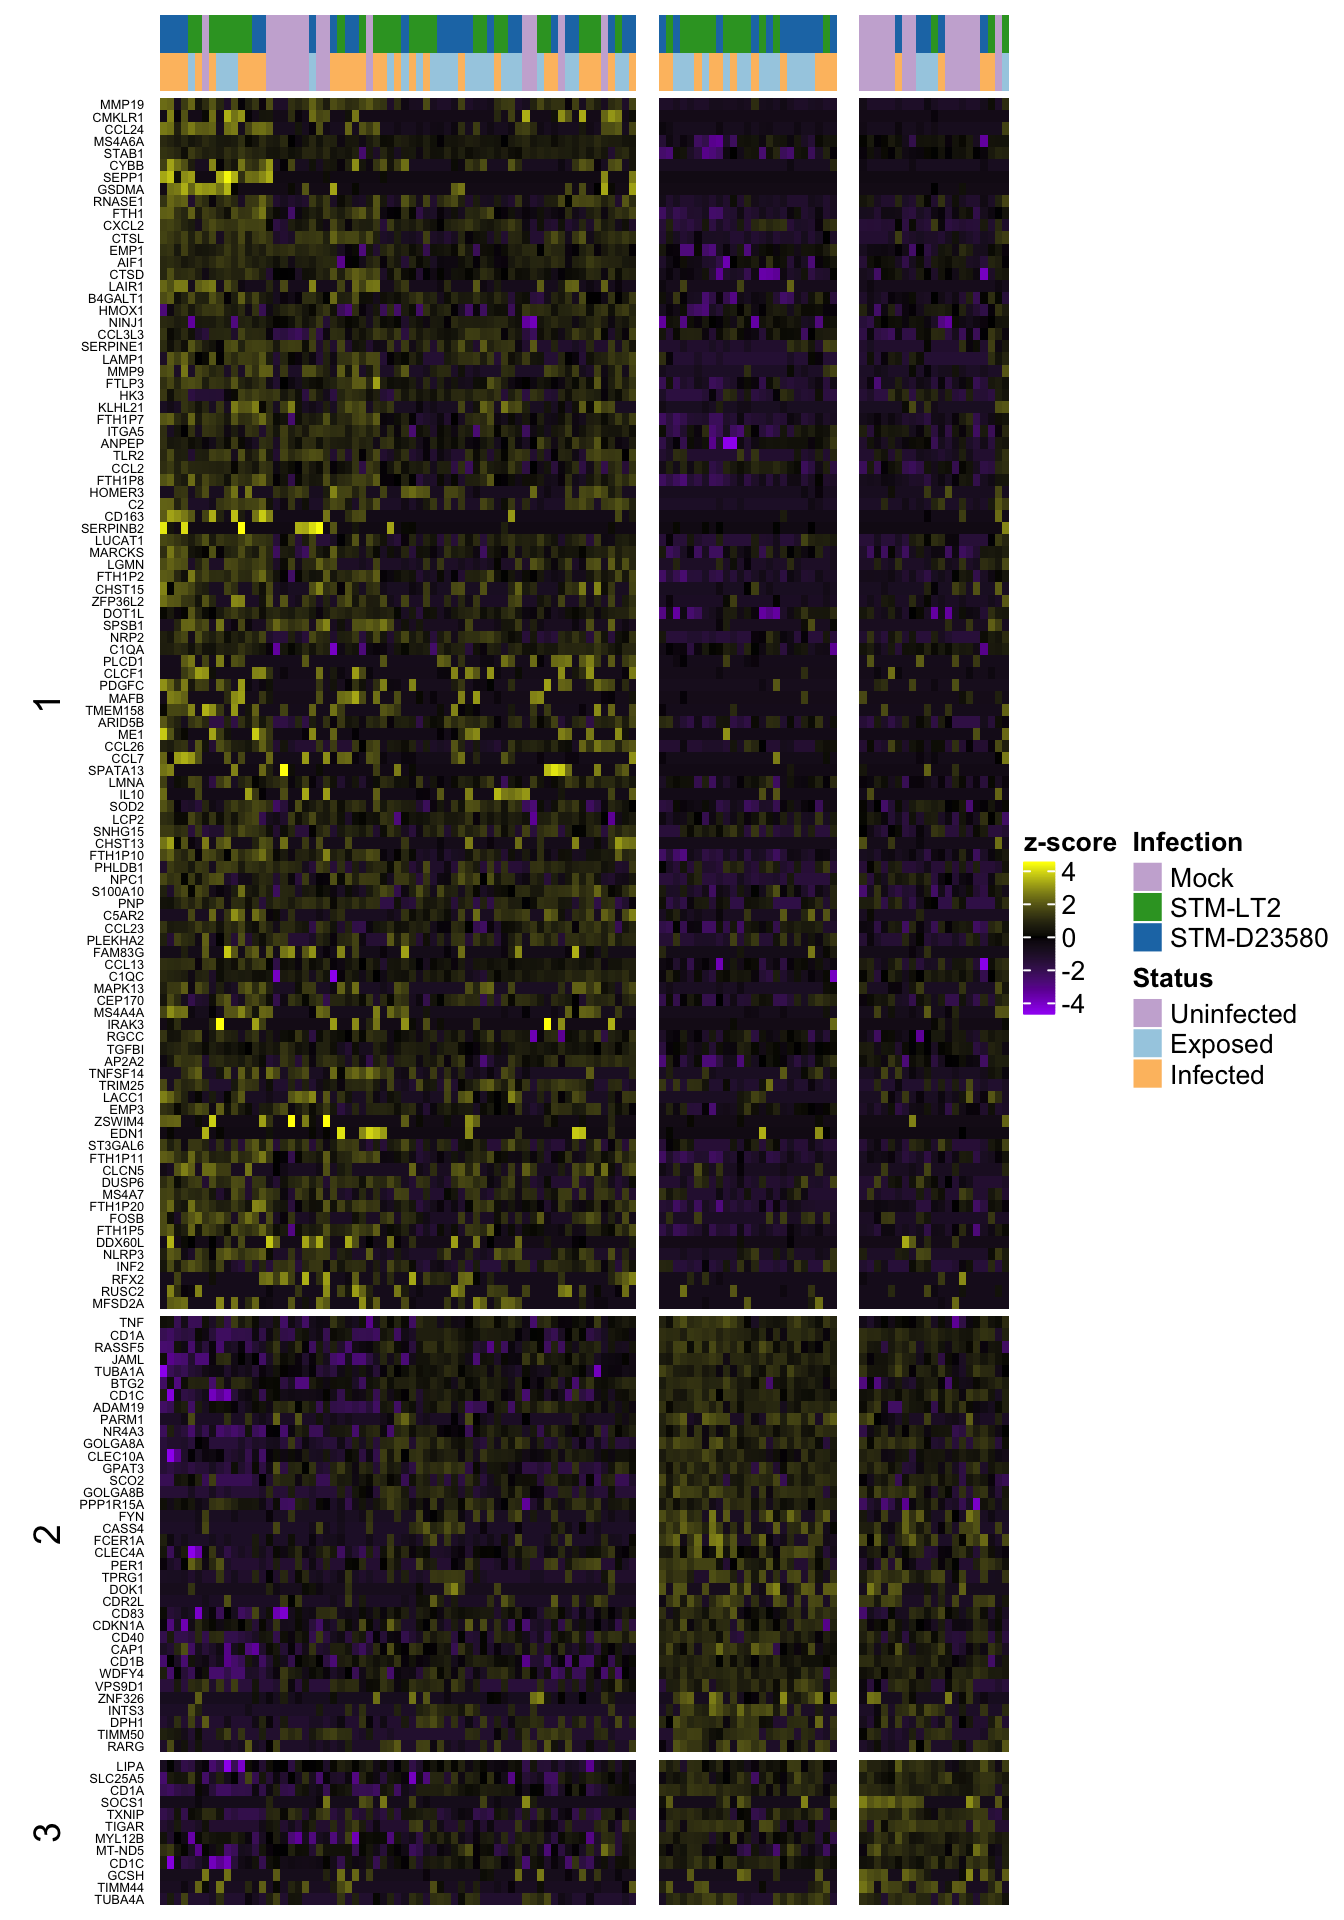
Heat map of row-scaled log-counts for (up to) 50 markers
Notably, let us use here the same markers as defined in the previous section, namely:
- P-value less than 0.01
- mle of log fold-change among the 50 largest positive values for a cluster
First of all, let us define a color scale share between upcoming row-scaled heat maps:
ht.col <- c("purple", "black", "yellow")2h
2h (w/out ‘0’)
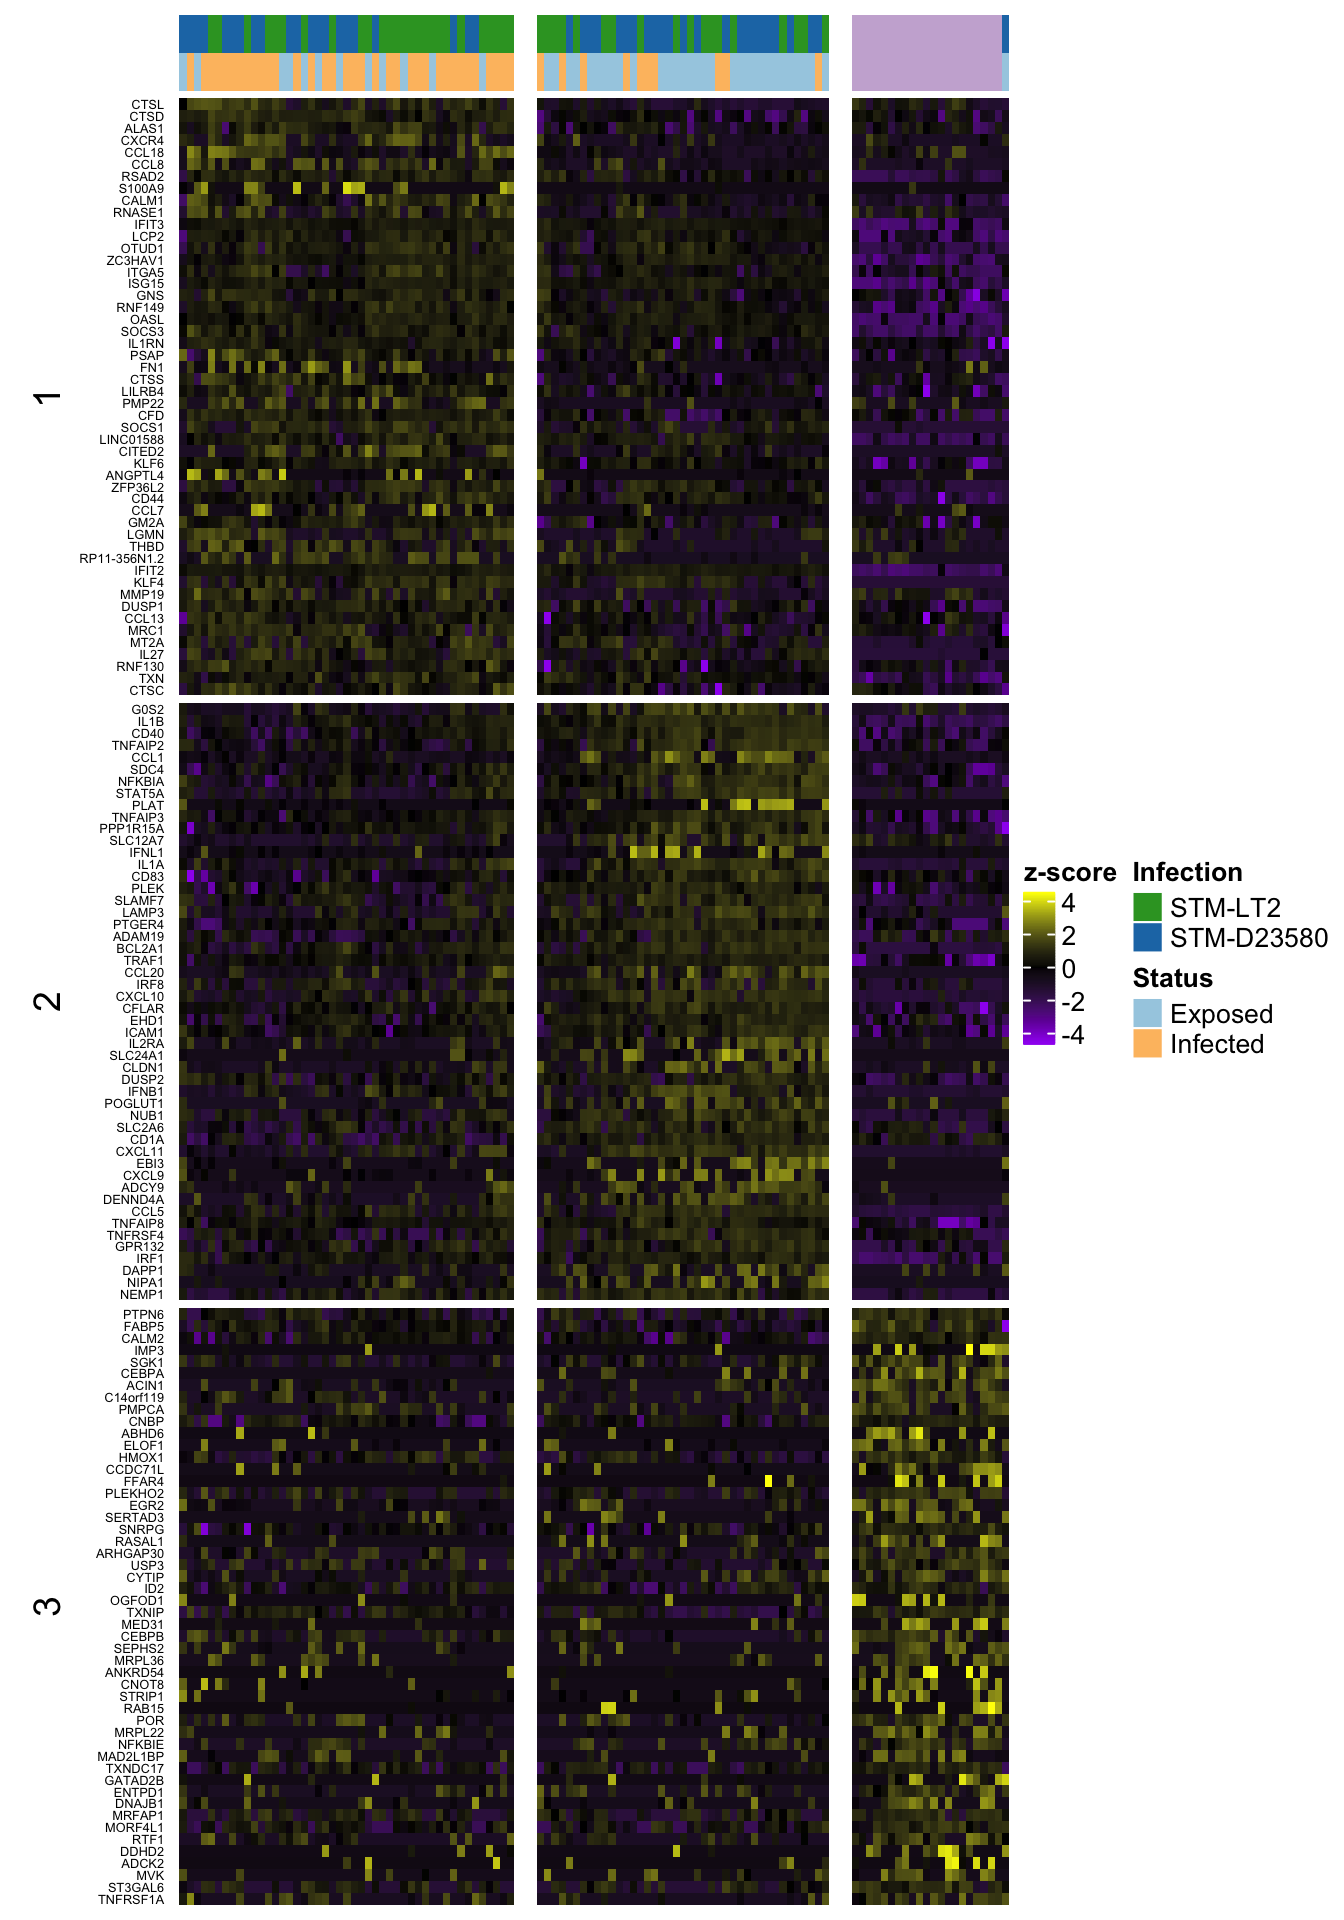
4h
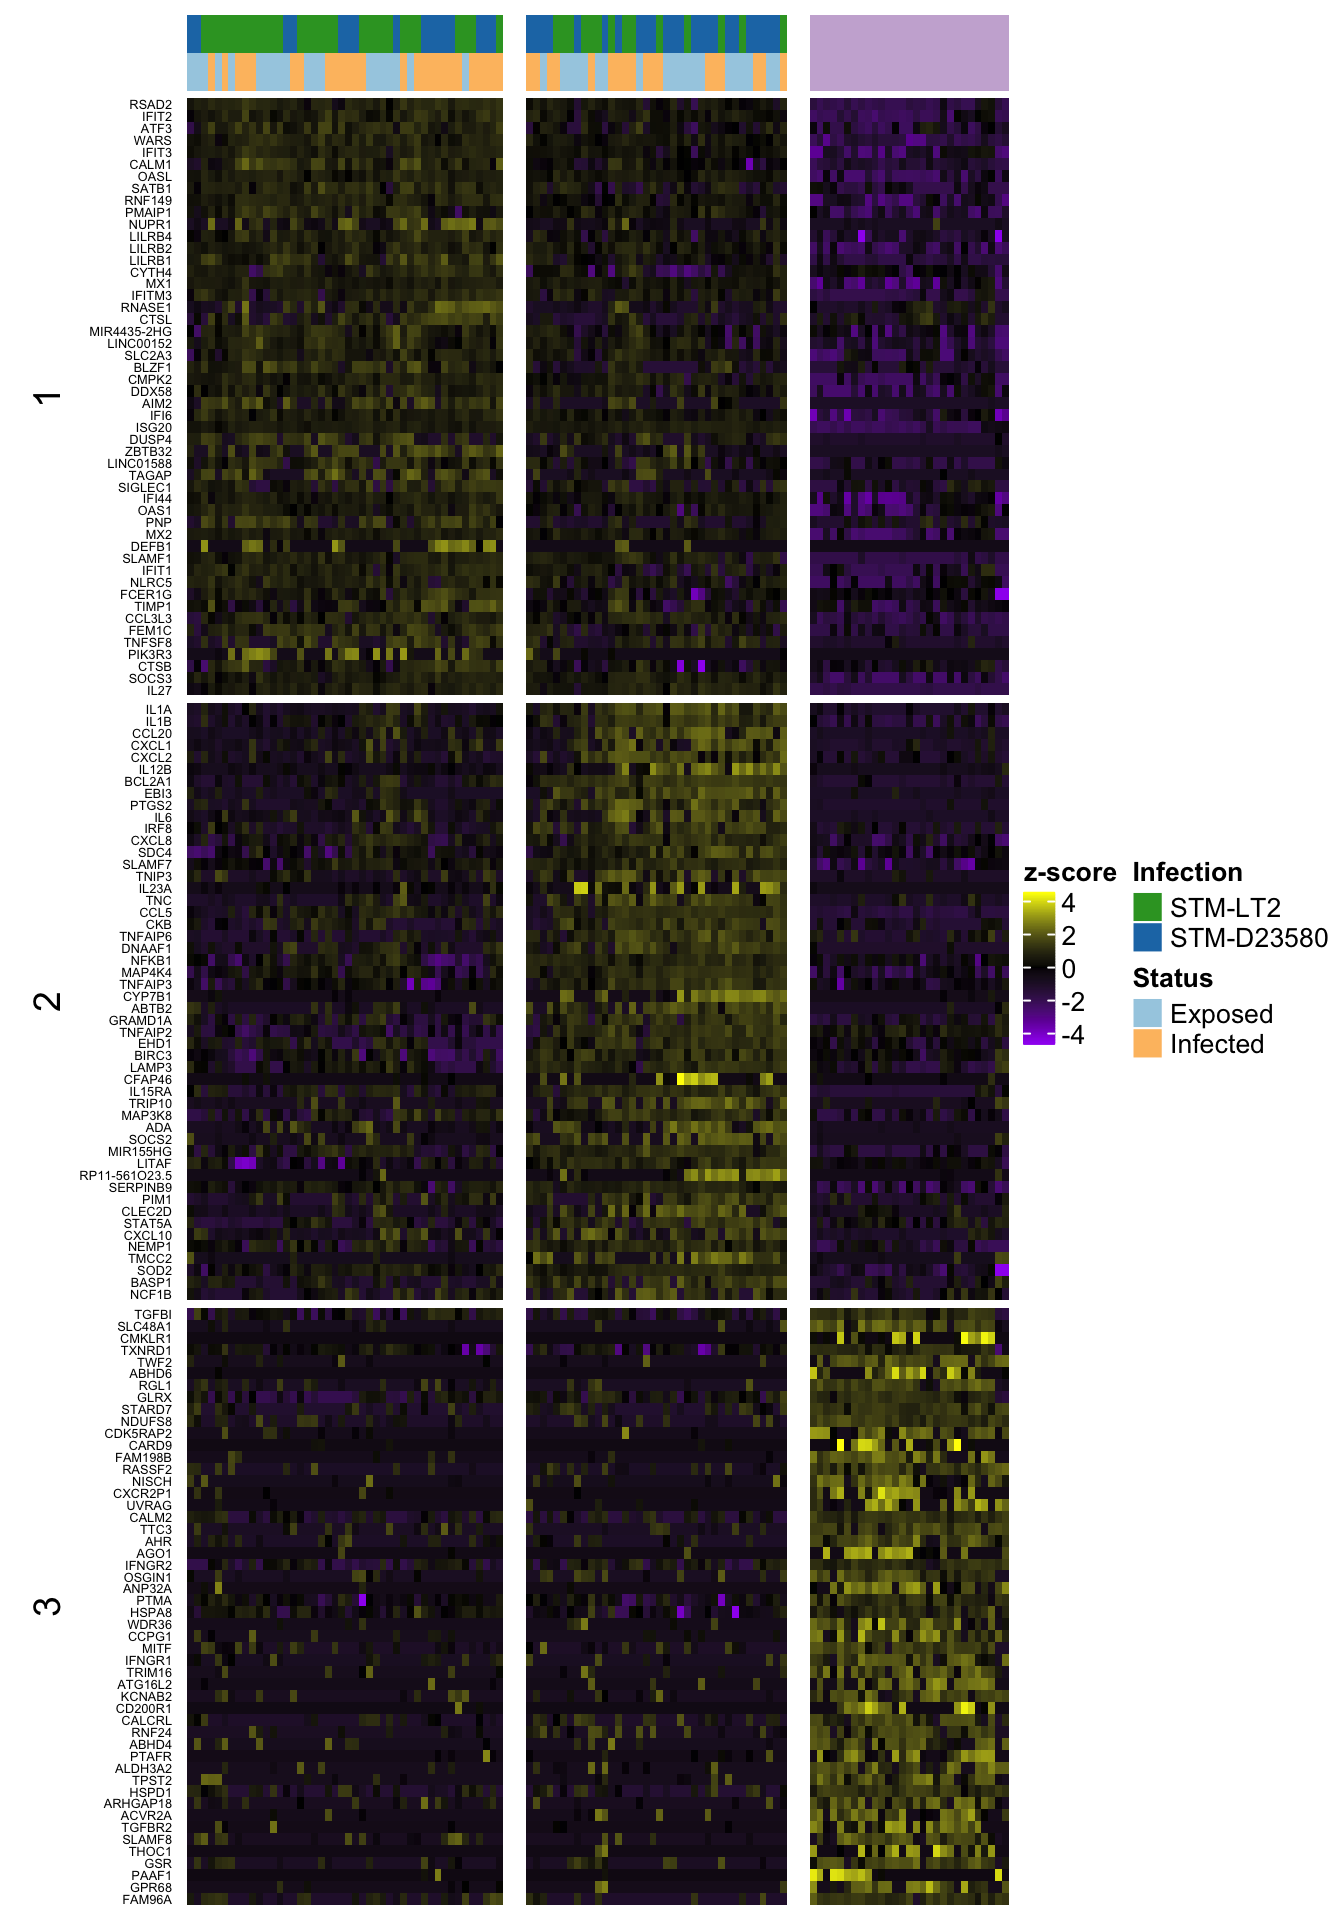
6h
Top 50 markers by significance
Identification
For each time point, let us identify gene markers of each cluster, and also trace the respective cluster for which each gene is a marker:
Note: a gene may be identified as a marker for more than one cluster.
2h
markers_2h_p <- character()
markers_2h_p.cluster <- factor(NULL, levels(sce.ifm.2h$quickCluster.2h))
c2h <- grep("^2h", names(scde.res), value = TRUE)
for (contrastName in c2h){
  clusterId <- gsub("2h_cluster(.)-Others", "\\1", contrastName)
  scde.table <- addGeneName(convert.z.score(scde.res[[contrastName]]))
  scde.table <- subset(scde.table, mle > 0 & p.value < 0.01)
  scde.table <- scde.table[order(scde.table$p.value),]
  scde.markers <- head(rownames(scde.table), 100)
  markers_2h_p <- c(markers_2h_p, scde.markers)
  markers_2h_p.cluster <-
    c(markers_2h_p.cluster, rep(clusterId, length(scde.markers)))
}
4h
markers_4h_p <- character()
markers_4h_p.cluster <- factor(NULL, levels(sce.ifm.4h$quickCluster.4h))
c4h <- grep("^4h", names(scde.res), value = TRUE)
for (contrastName in c4h){
  clusterId <- gsub("4h_cluster(.)-Others", "\\1", contrastName)
  scde.table <- addGeneName(convert.z.score(scde.res[[contrastName]]))
  scde.table <- subset(scde.table, mle > 0 & p.value < 0.01)
  scde.table <- scde.table[order(scde.table$p.value),]
  scde.markers <- head(rownames(scde.table), 50)
  markers_4h_p <- c(markers_4h_p, scde.markers)
  markers_4h_p.cluster <-
    c(markers_4h_p.cluster, rep(clusterId, length(scde.markers)))
}
6h
markers_6h_p <- character()
markers_6h_p.cluster <- factor(NULL, levels(sce.ifm.6h$quickCluster.6h))
c6h <- grep("^6h", names(scde.res), value = TRUE)
for (contrastName in c6h){
  clusterId <- gsub("6h_cluster(.)-Others", "\\1", contrastName)
  scde.table <- addGeneName(convert.z.score(scde.res[[contrastName]]))
  scde.table <- subset(scde.table, mle > 0 & p.value < 0.01)
  scde.table <- scde.table[order(scde.table$p.value),]
  scde.markers <- head(rownames(scde.table), 50)
  markers_6h_p <- c(markers_6h_p, scde.markers)
  markers_6h_p.cluster <-
    c(markers_6h_p.cluster, rep(clusterId, length(scde.markers)))
}
Heat map of fold-change for (up to) 50 markers
For each time point, let us display up to 50 marker genes for each cluster, selected for having:
- P-value less than 0.01
- mle of log fold-change among the 50 largest positive values for a cluster
2h
4h
6h
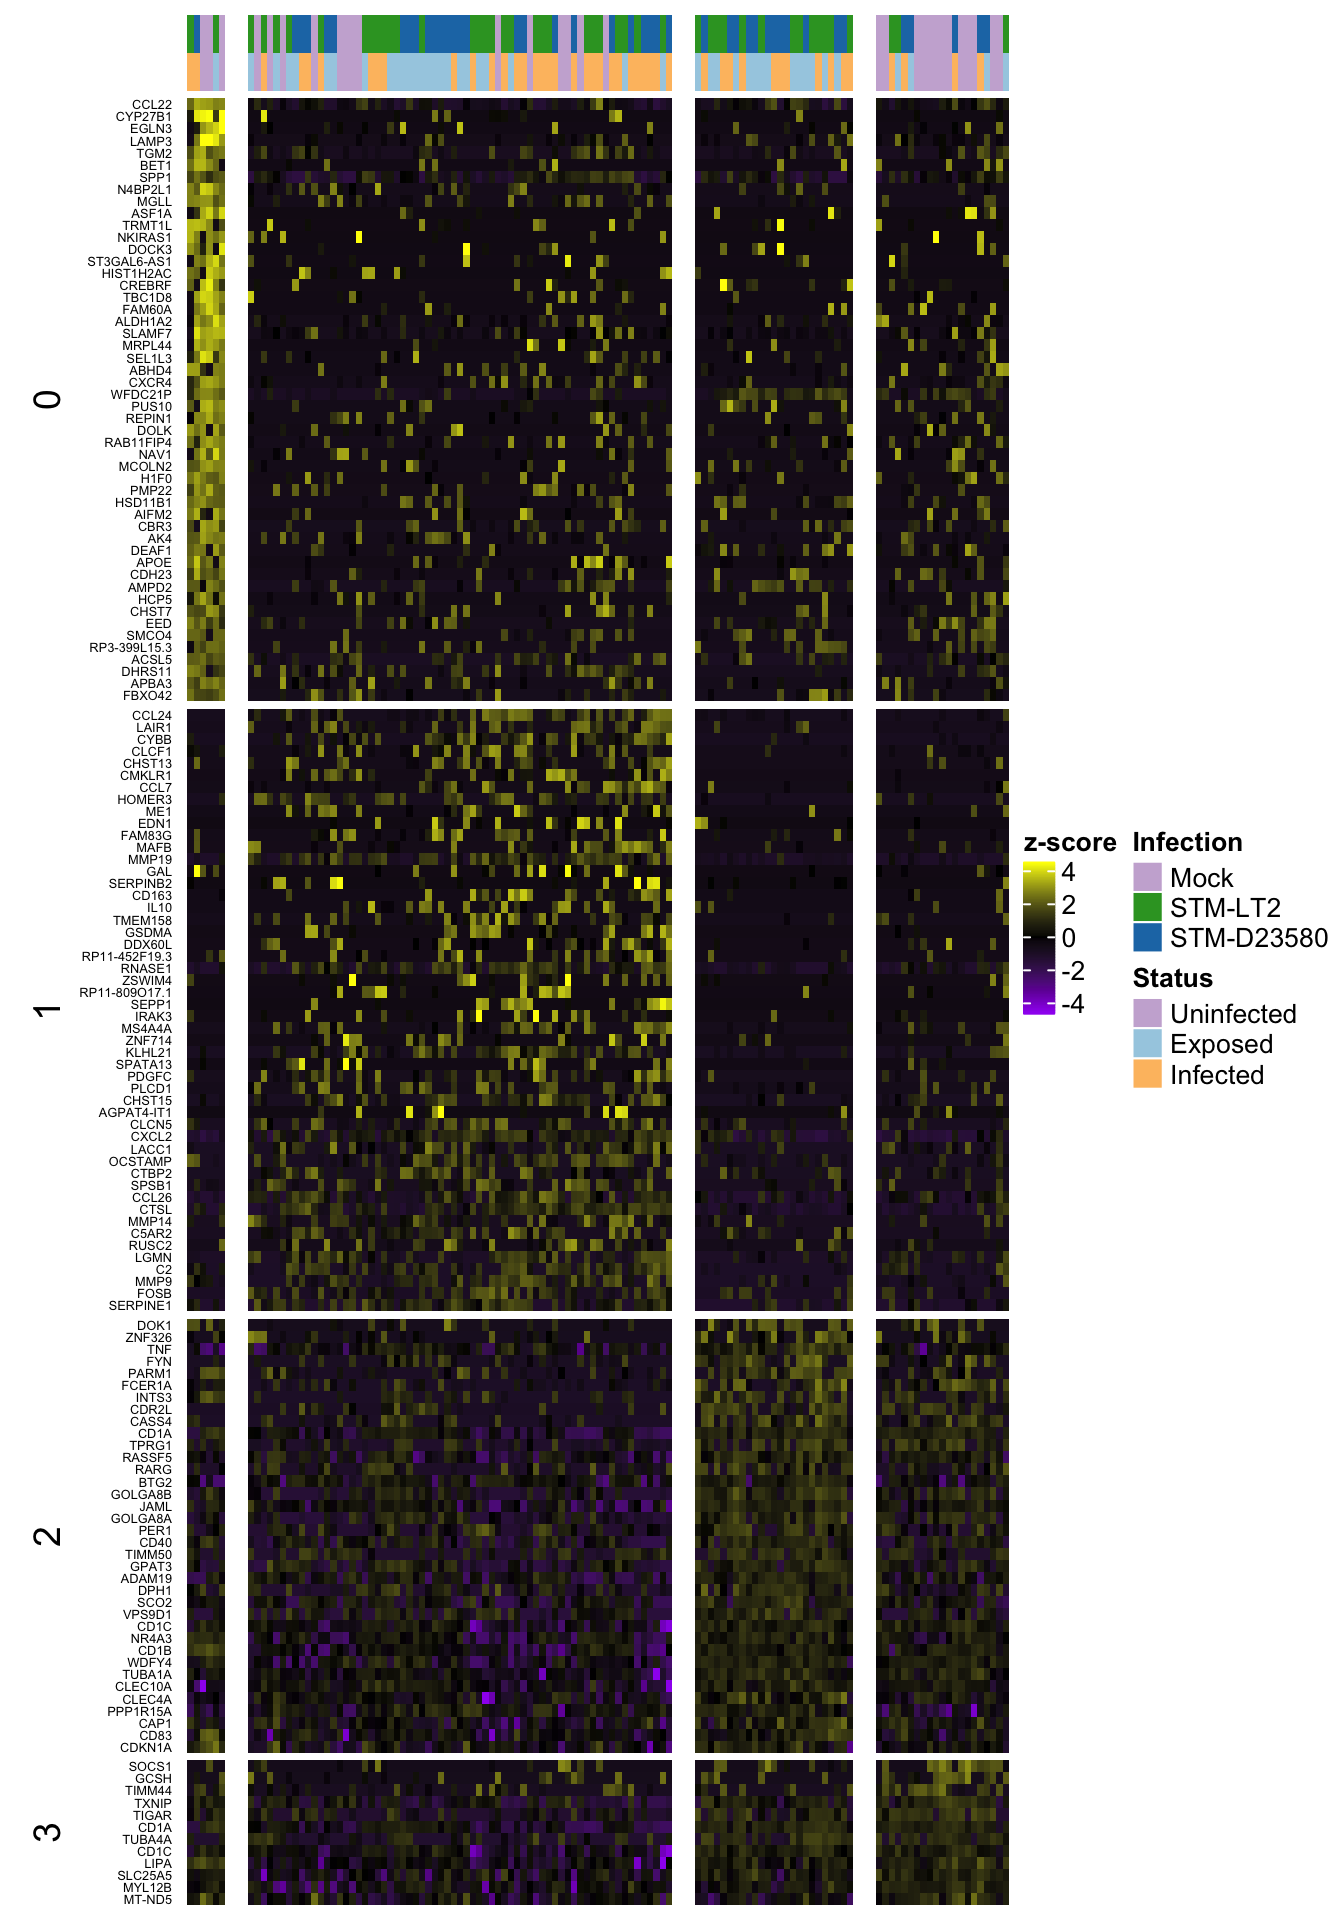
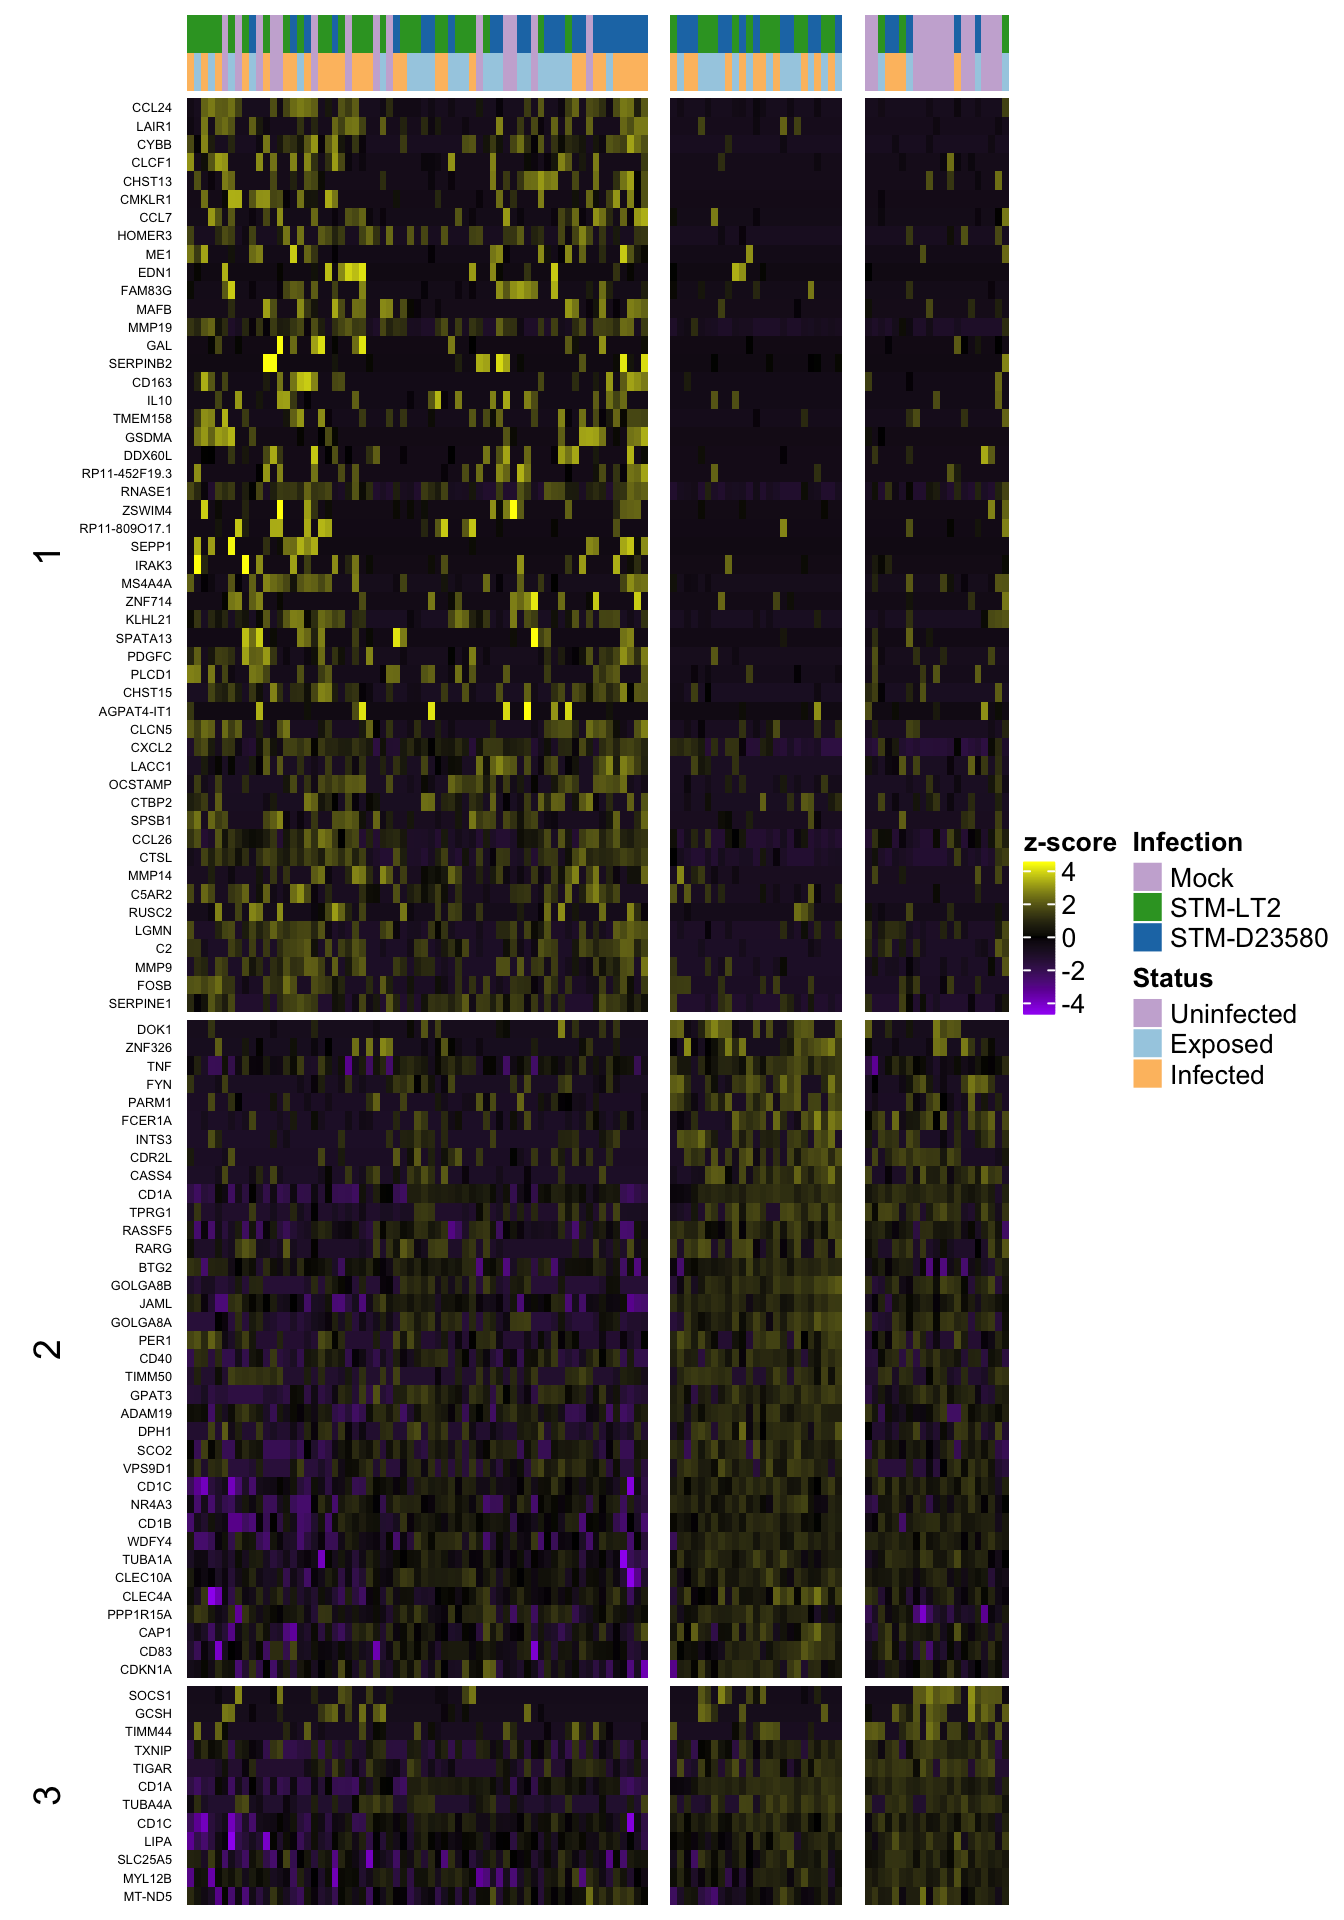
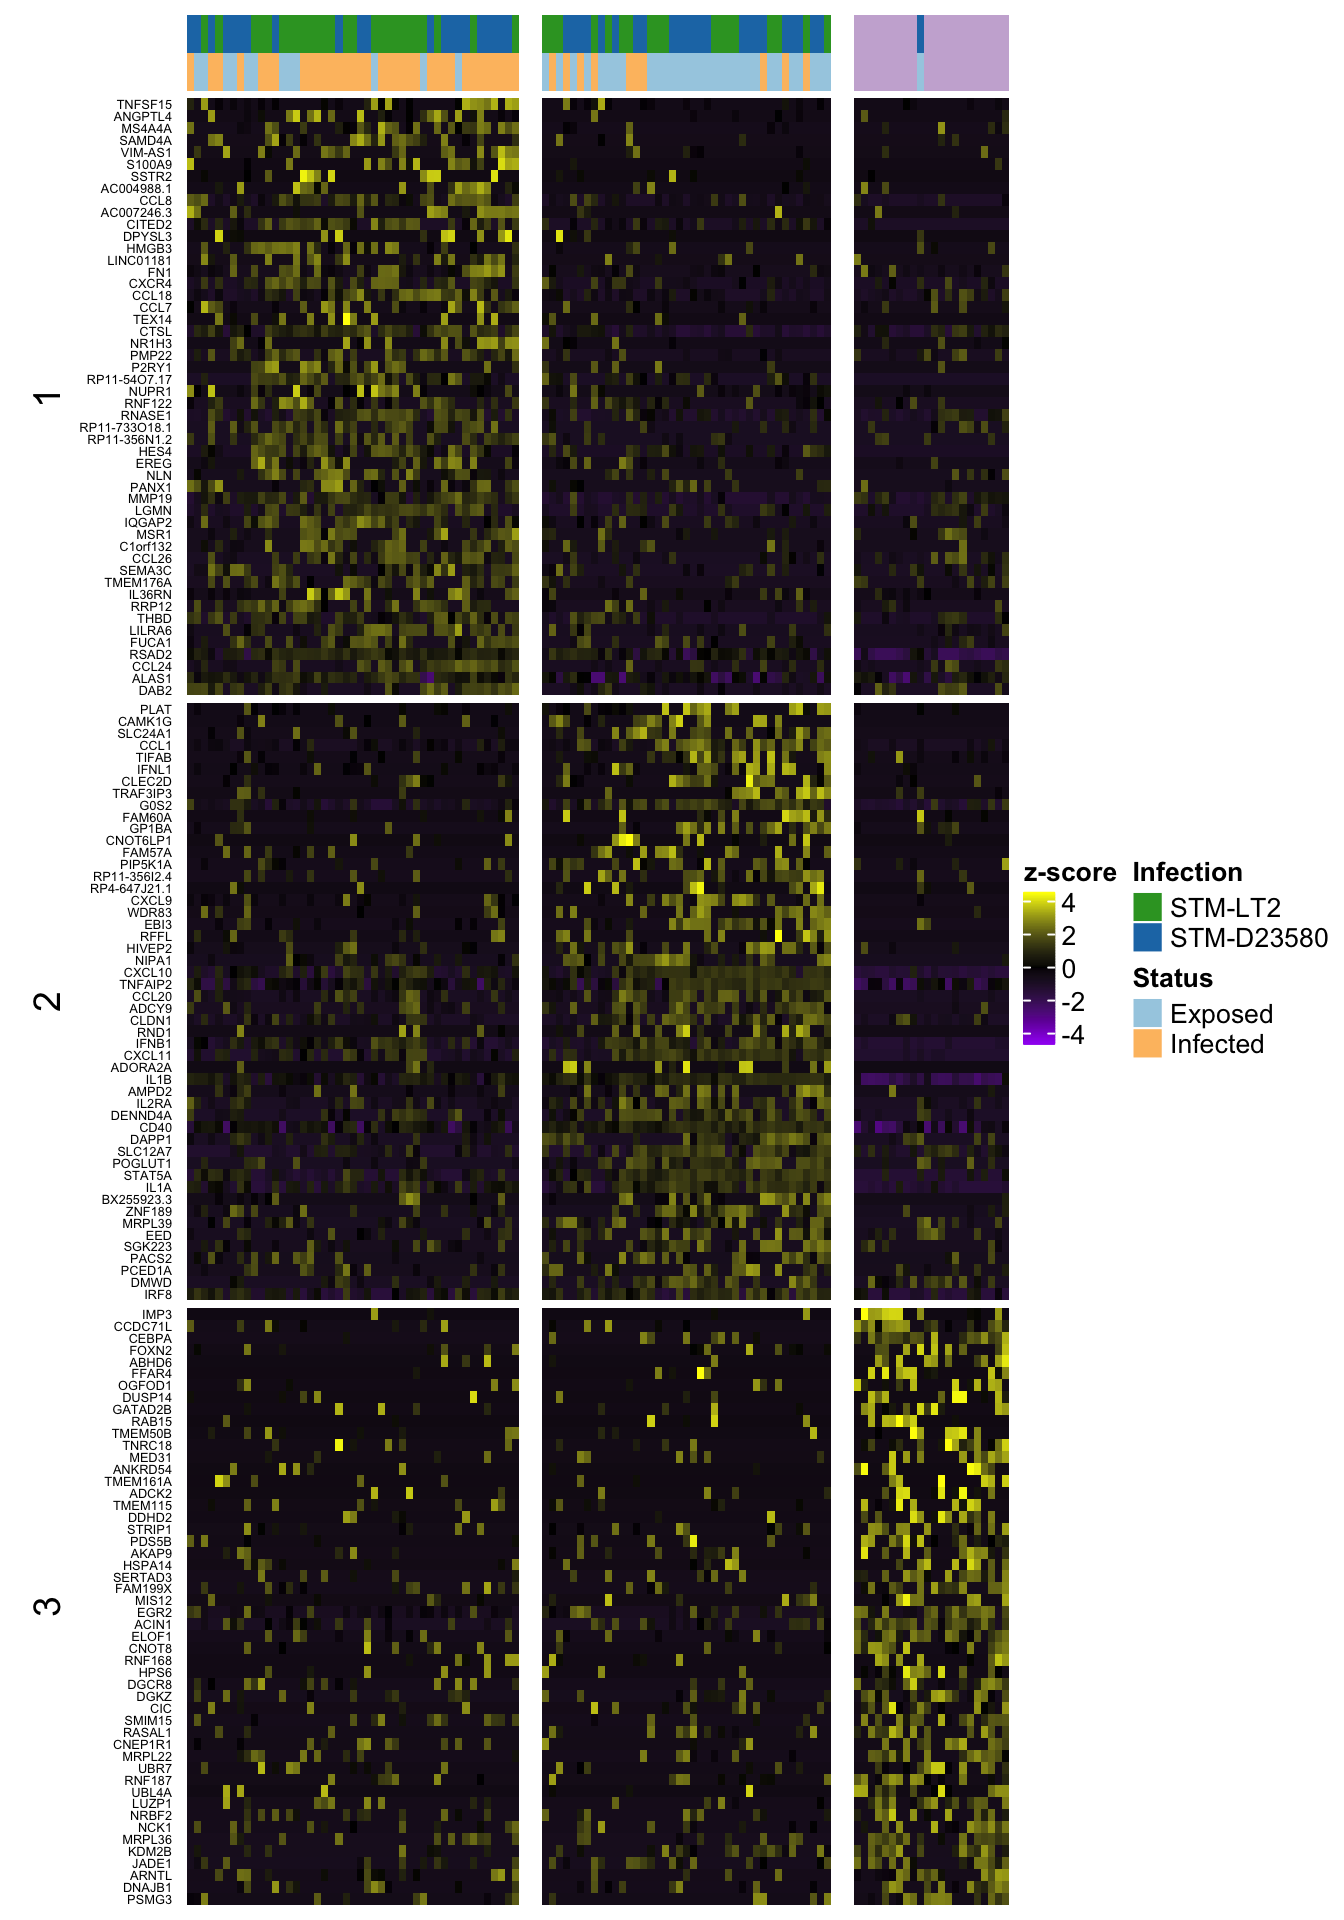
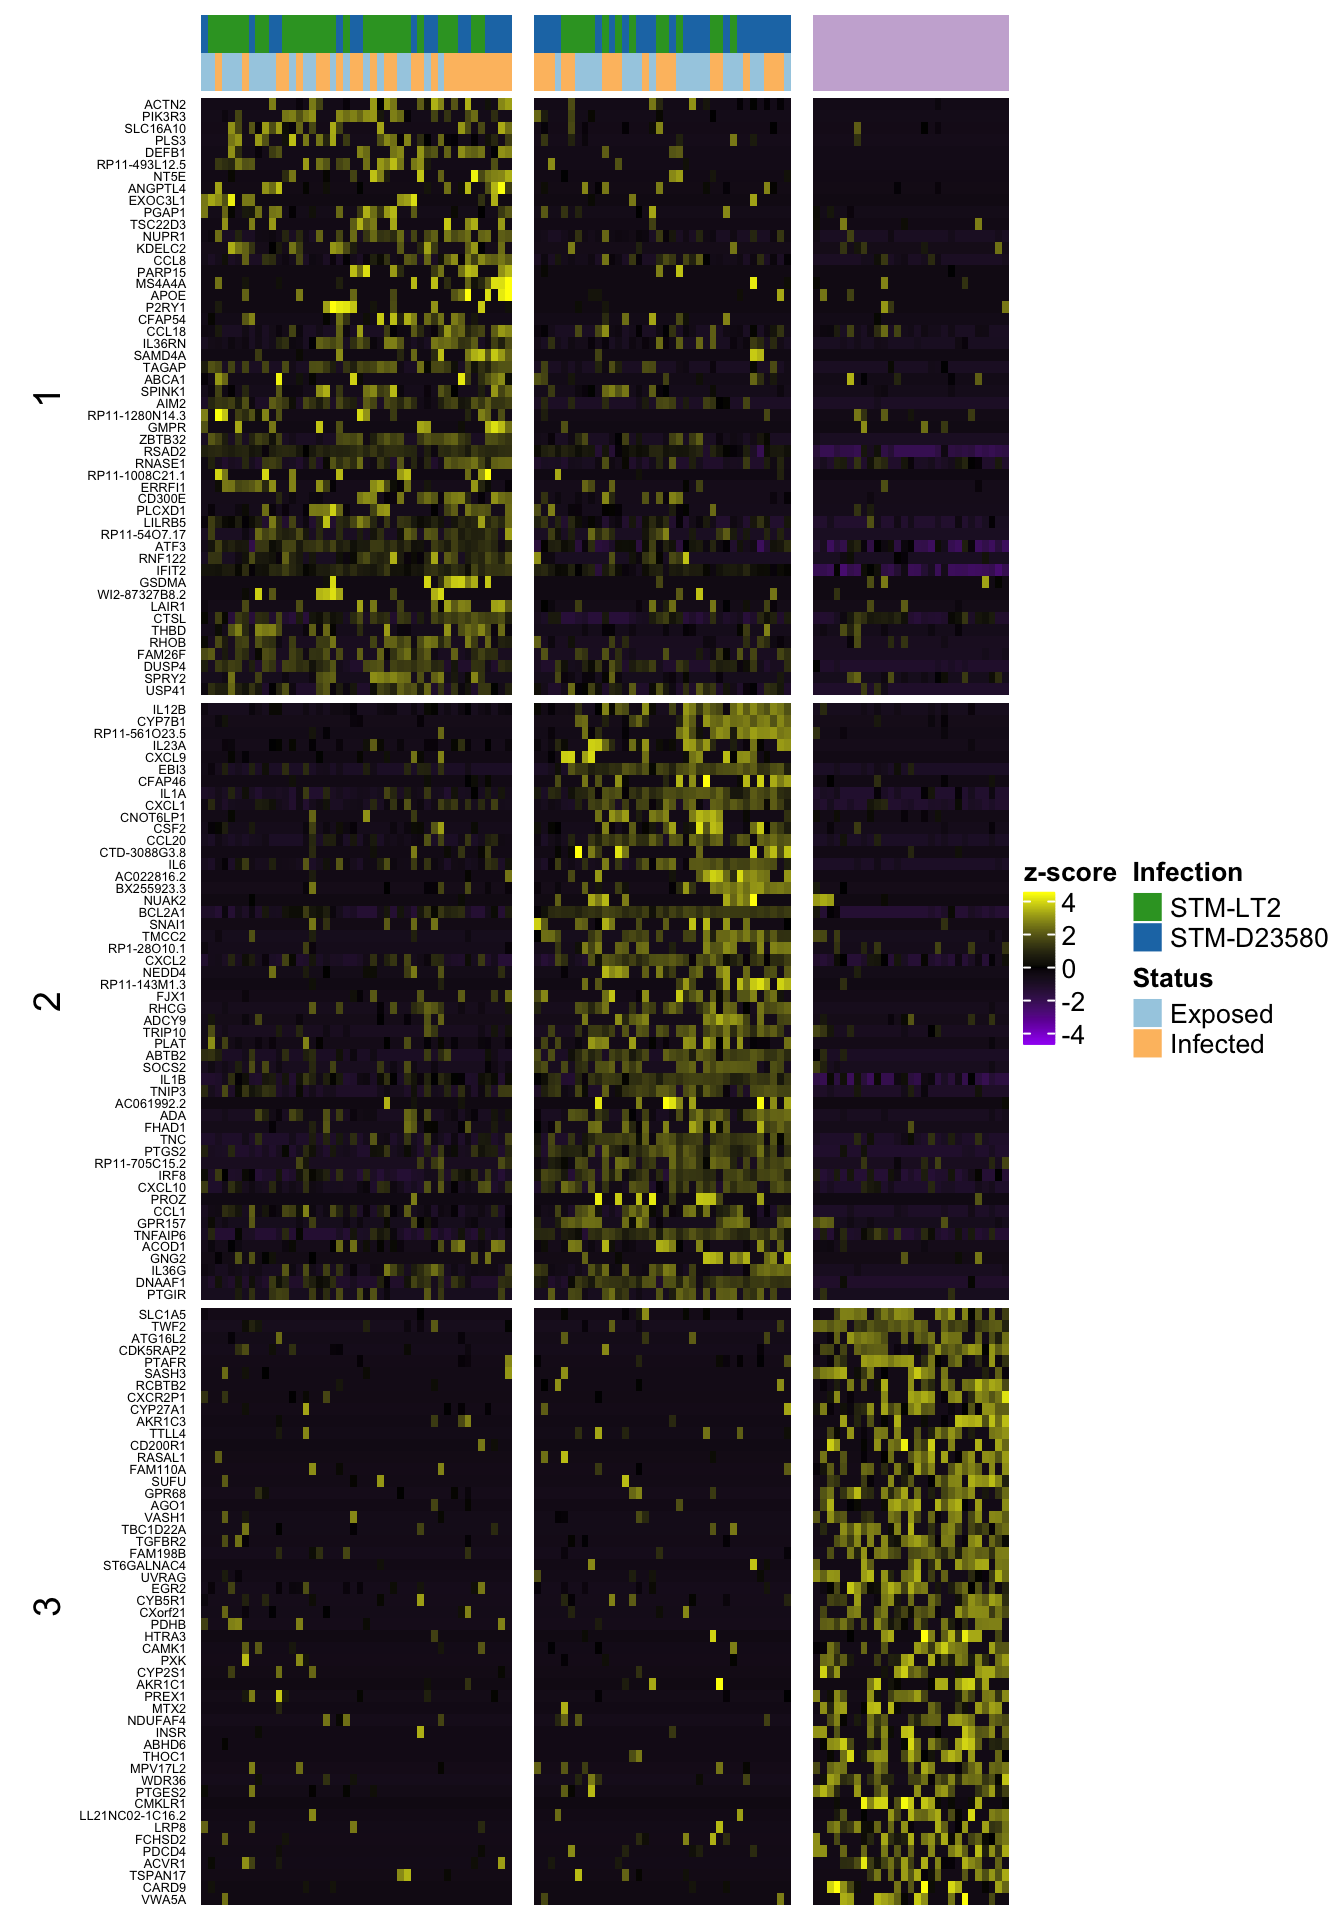
Heat map of row-scaled log-counts for (up to) 50 markers
Notably, let us use here the same markers as defined in the previous section, namely:
- P-value less than 0.01
- P-value among the 50 smallest values for a cluster
2h
2h (w/out ‘0’)
4h
6h
Gene ontology
Let us use the goseq package to identify the most enriched gene ontologies among the various lists of positive markers. Note that we restrict the results to GO categories associated with at least 10 genes, for robustness.
Let us first define:
- a list to store the GO enrichment tables returned by goseq
goseq.res <- list()- the gene length information reported by featureCounts:
geneLengths <- width(sce.endo)
names(geneLengths) <- rownames(sce.endo)
Computation
2h
bg.2h <- rownames(cd.ifm.2h)
for (contrastName in c2h){
message(contrastName)
clusterId <- gsub("2h_cluster(.)-Others", "\\1", contrastName)
scde.table <- convert.z.score(scde.res[[contrastName]])
scde.table <- subset(scde.table, mle > 0 & p.value < 0.01)
marker.genes <- (bg.2h %in% rownames(scde.table))
names(marker.genes) <- bg.2h; table(marker.genes)
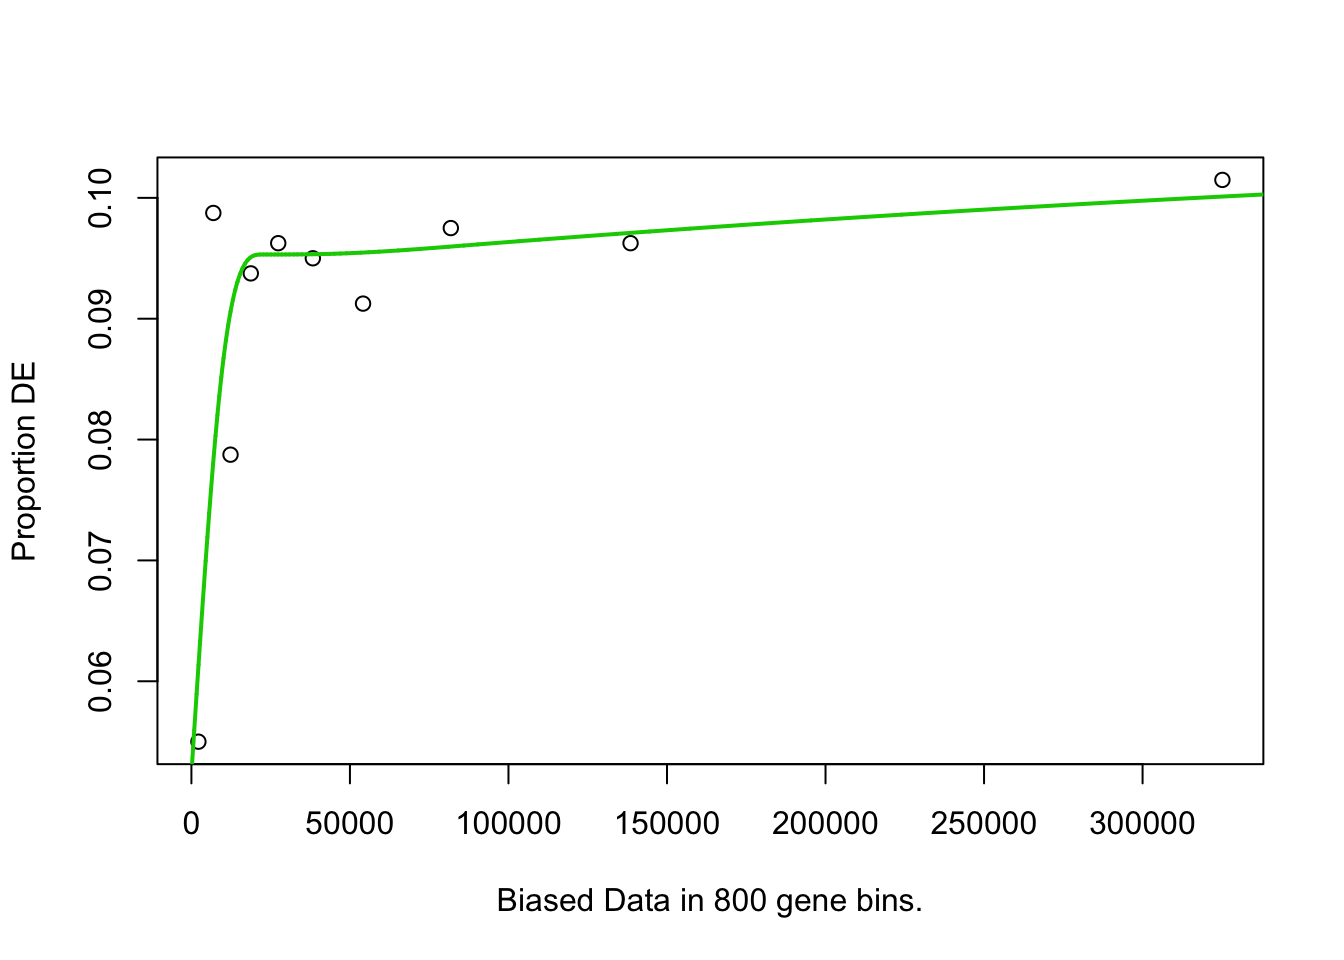
pwf <- nullp(marker.genes, bias.data = geneLengths[names(marker.genes)])
go.res <- goseq(pwf, "hg38", "ensGene")
goseq.res[[contrastName]] <- go.res
saveRDS(goseq.res, "rds/goseq_markers.rds") # checkpoint
}## 2h_cluster0-Others## Warning in pcls(G): initial point very close to some inequality constraints## Fetching GO annotations...## Loading required package: AnnotationDbi##
## Attaching package: 'AnnotationDbi'## The following object is masked from 'package:dplyr':
##
## select## ## For 626 genes, we could not find any categories. These genes will be excluded.## To force their use, please run with use_genes_without_cat=TRUE (see documentation).## This was the default behavior for version 1.15.1 and earlier.## Calculating the p-values...## 'select()' returned 1:1 mapping between keys and columns## 2h_cluster1-Others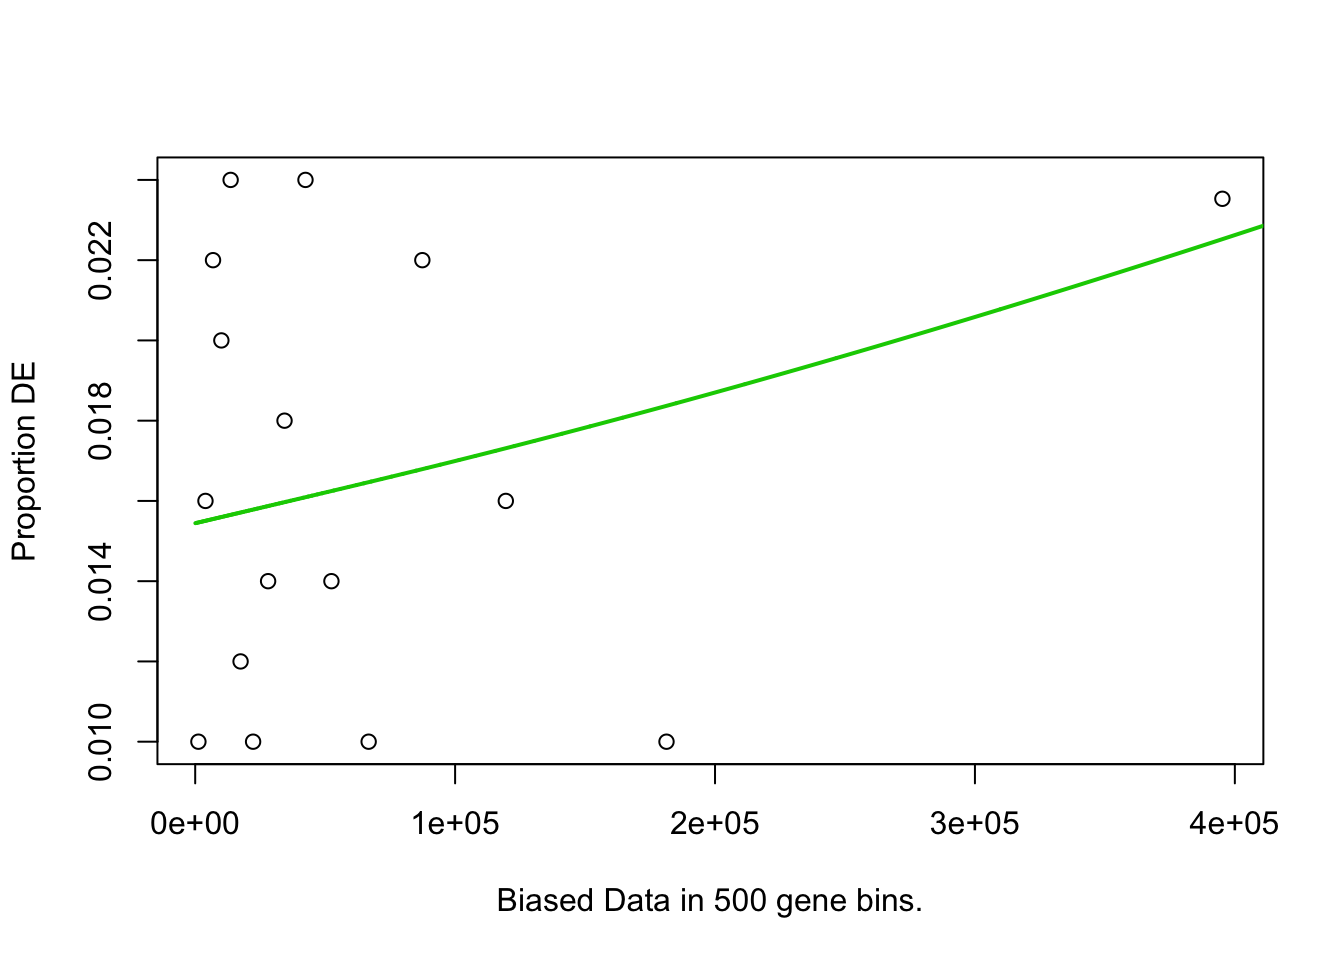
## Fetching GO annotations...## For 626 genes, we could not find any categories. These genes will be excluded.## To force their use, please run with use_genes_without_cat=TRUE (see documentation).## This was the default behavior for version 1.15.1 and earlier.## Calculating the p-values...## 'select()' returned 1:1 mapping between keys and columns## 2h_cluster2-Others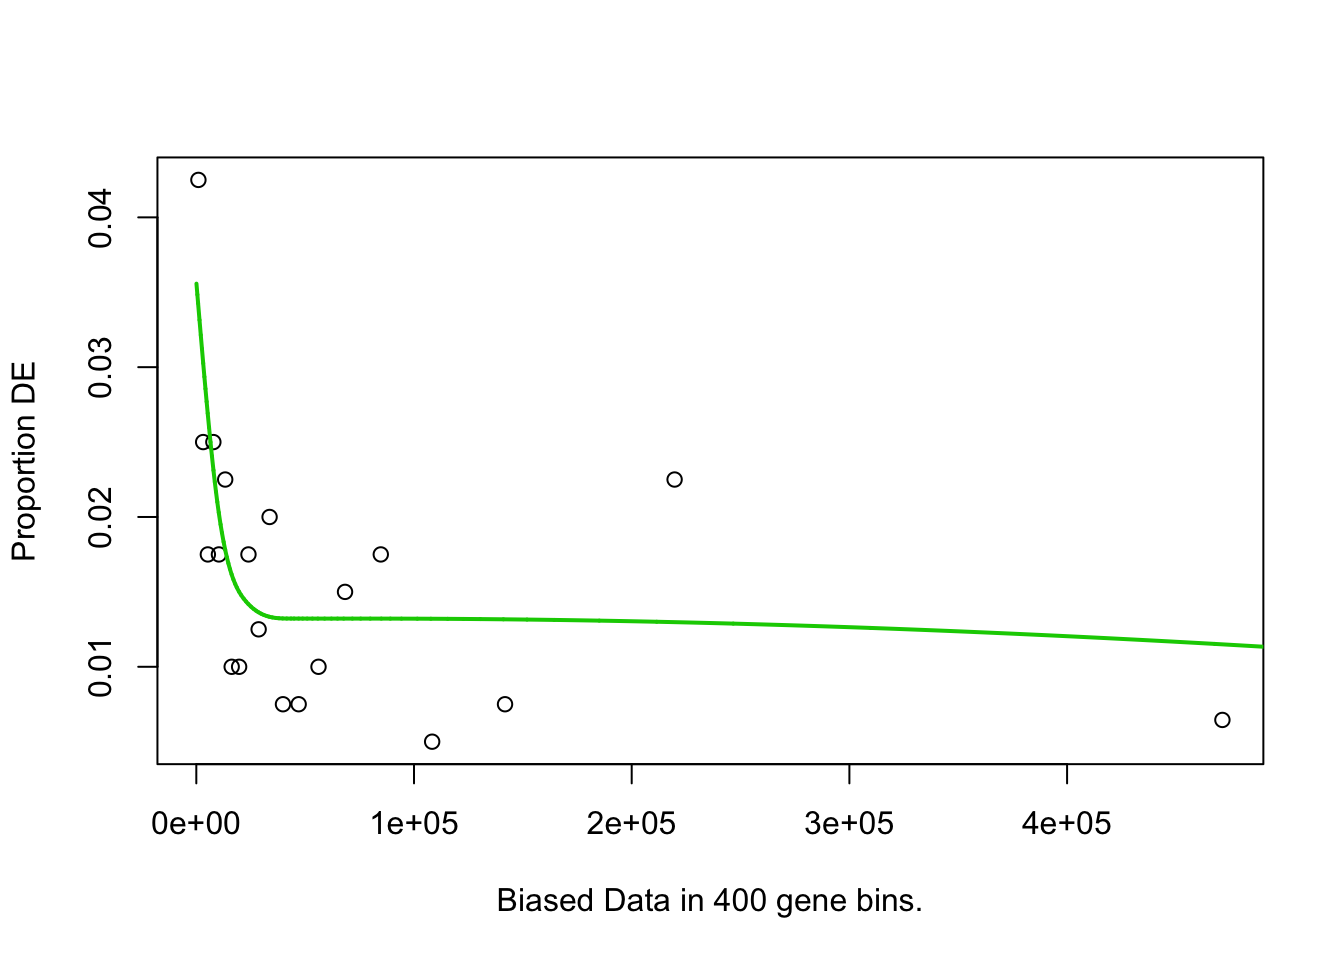
## Fetching GO annotations...## For 626 genes, we could not find any categories. These genes will be excluded.## To force their use, please run with use_genes_without_cat=TRUE (see documentation).## This was the default behavior for version 1.15.1 and earlier.## Calculating the p-values...## 'select()' returned 1:1 mapping between keys and columns## 2h_cluster3-Others
## Fetching GO annotations...## For 626 genes, we could not find any categories. These genes will be excluded.## To force their use, please run with use_genes_without_cat=TRUE (see documentation).## This was the default behavior for version 1.15.1 and earlier.## Calculating the p-values...## 'select()' returned 1:1 mapping between keys and columns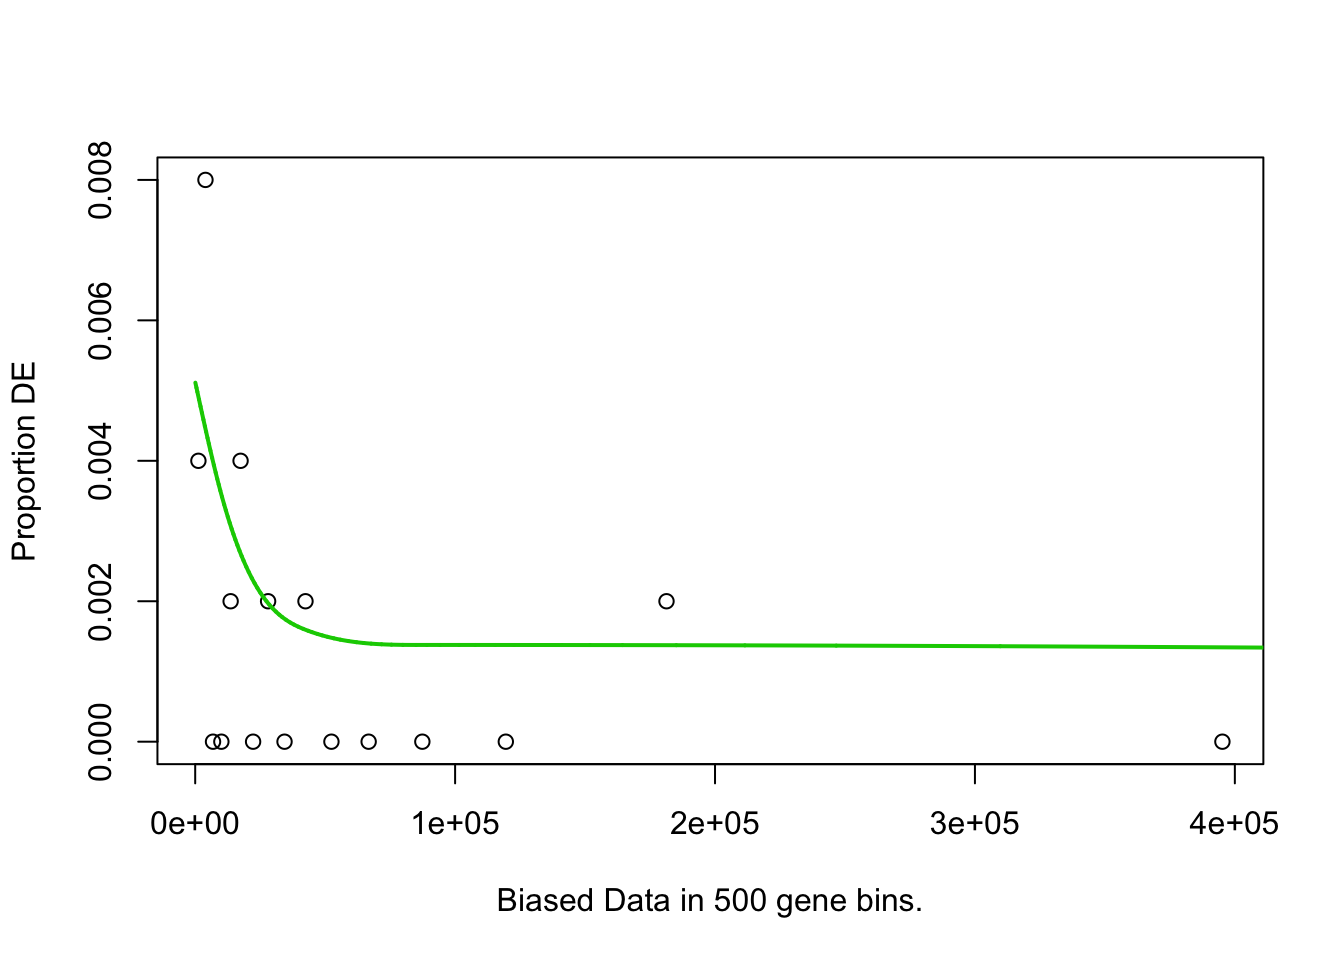
4h
bg.4h <- rownames(cd.ifm.4h)
for (contrastName in c4h){
  message(contrastName)
  clusterId <- gsub("4h_cluster(.)-Others", "\\1", contrastName)
  scde.table <- convert.z.score(scde.res[[contrastName]])
  scde.table <- subset(scde.table, mle > 0 & p.value < 0.01)
  marker.genes <- (bg.4h %in% rownames(scde.table))
  names(marker.genes) <- bg.4h; table(marker.genes)
  pwf <- nullp(marker.genes, bias.data = geneLengths[names(marker.genes)])
  go.res <- goseq(pwf, "hg38", "ensGene")
  goseq.res[[contrastName]] <- go.res
  saveRDS(goseq.res, "rds/goseq_markers.rds") # checkpoint
}
## 4h_cluster1-Others## Fetching GO annotations...## For 632 genes, we could not find any categories. These genes will be excluded.## To force their use, please run with use_genes_without_cat=TRUE (see documentation).## This was the default behavior for version 1.15.1 and earlier.## Calculating the p-values...## 'select()' returned 1:1 mapping between keys and columns## 4h_cluster2-Others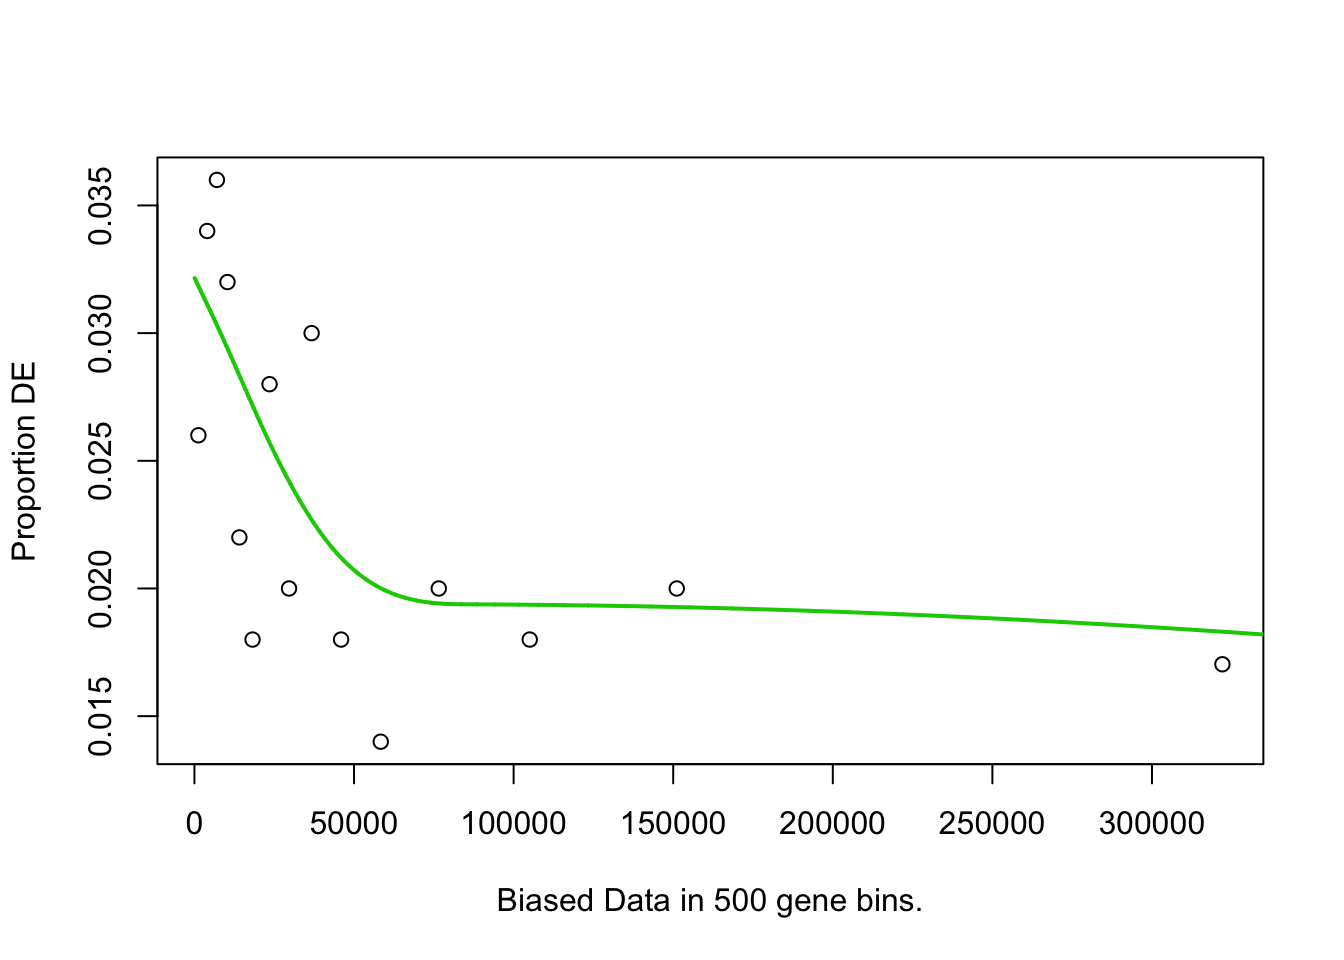
## Fetching GO annotations...## For 632 genes, we could not find any categories. These genes will be excluded.## To force their use, please run with use_genes_without_cat=TRUE (see documentation).## This was the default behavior for version 1.15.1 and earlier.## Calculating the p-values...## 'select()' returned 1:1 mapping between keys and columns## 4h_cluster3-Others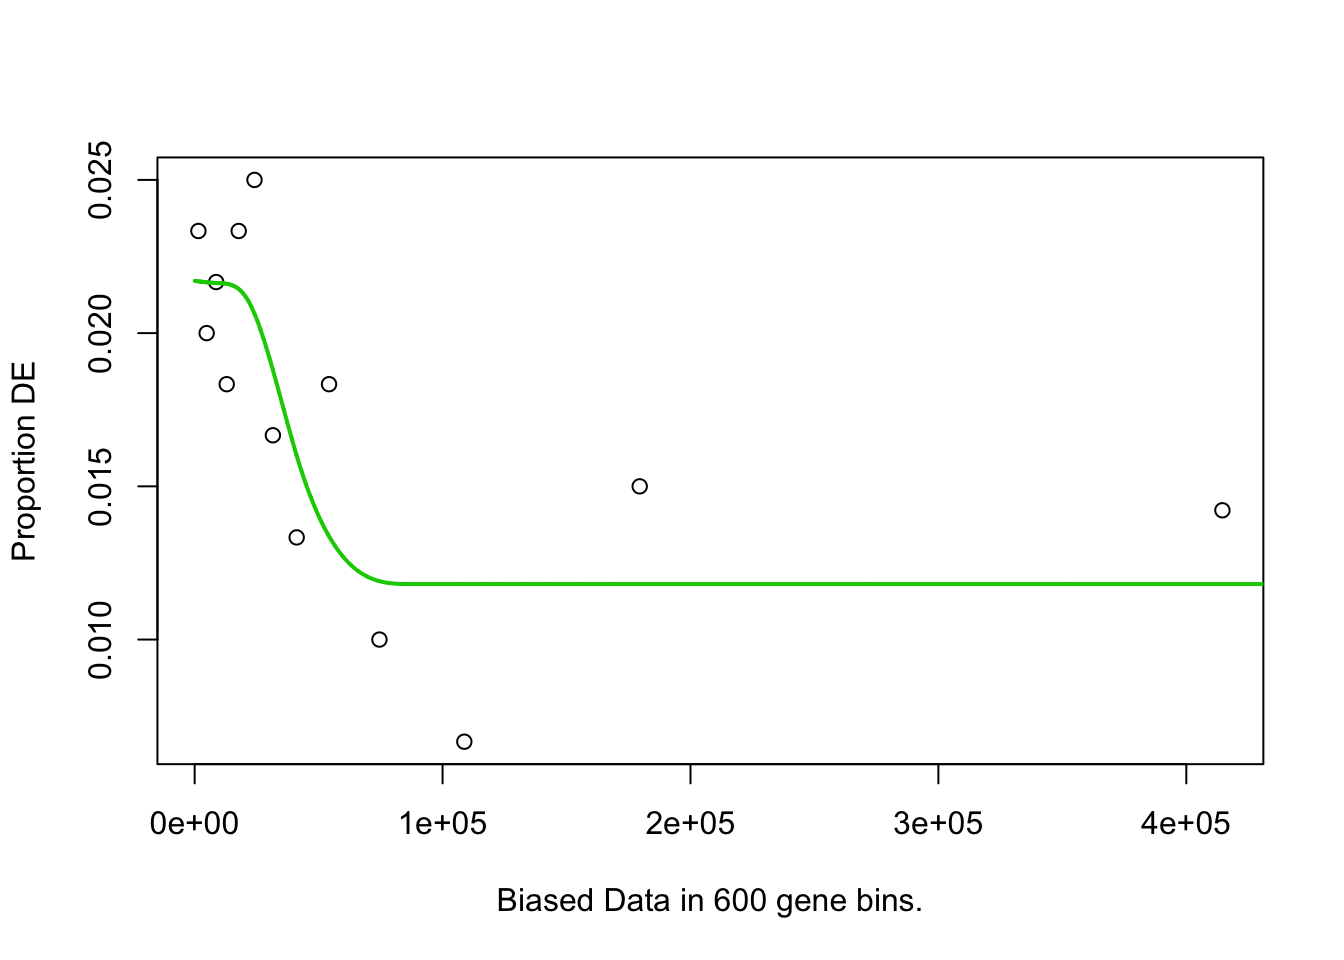
## Fetching GO annotations...## For 632 genes, we could not find any categories. These genes will be excluded.## To force their use, please run with use_genes_without_cat=TRUE (see documentation).## This was the default behavior for version 1.15.1 and earlier.## Calculating the p-values...## 'select()' returned 1:1 mapping between keys and columns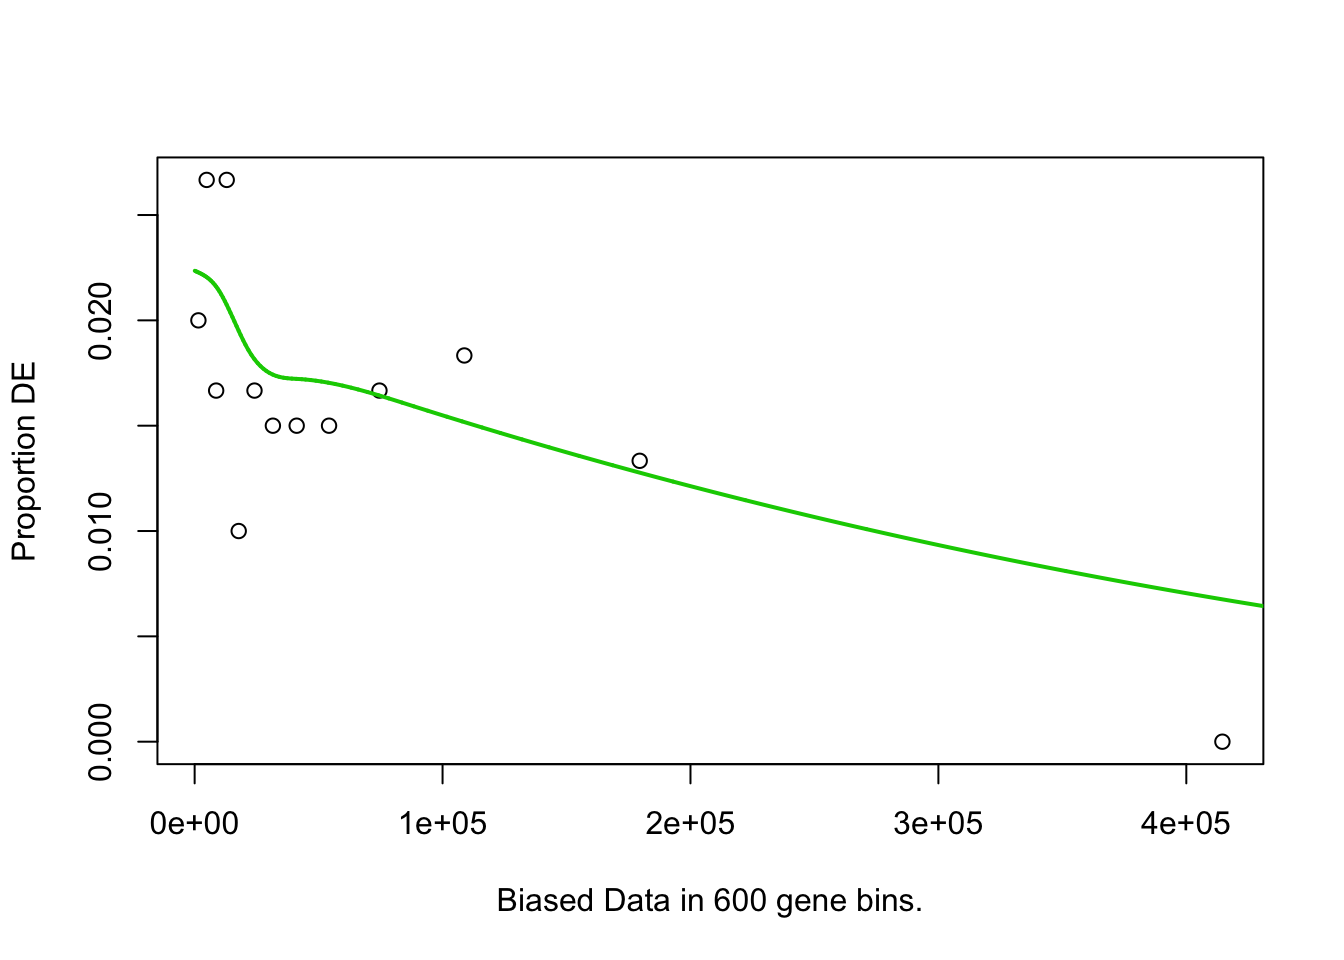
6h
bg.6h <- rownames(cd.ifm.6h)
for (contrastName in c6h){
  message(contrastName)
  clusterId <- gsub("6h_cluster(.)-Others", "\\1", contrastName)
  scde.table <- convert.z.score(scde.res[[contrastName]])
  scde.table <- subset(scde.table, mle > 0 & p.value < 0.01)
  marker.genes <- (bg.6h %in% rownames(scde.table))
  names(marker.genes) <- bg.6h; table(marker.genes)
  pwf <- nullp(marker.genes, bias.data = geneLengths[names(marker.genes)])
  go.res <- goseq(pwf, "hg38", "ensGene")
  goseq.res[[contrastName]] <- go.res
  saveRDS(goseq.res, "rds/goseq_markers.rds") # checkpoint
}
## 6h_cluster1-Others## Warning in pcls(G): initial point very close to some inequality constraints## Fetching GO annotations...## For 605 genes, we could not find any categories. These genes will be excluded.## To force their use, please run with use_genes_without_cat=TRUE (see documentation).## This was the default behavior for version 1.15.1 and earlier.## Calculating the p-values...## 'select()' returned 1:1 mapping between keys and columns## 6h_cluster2-Others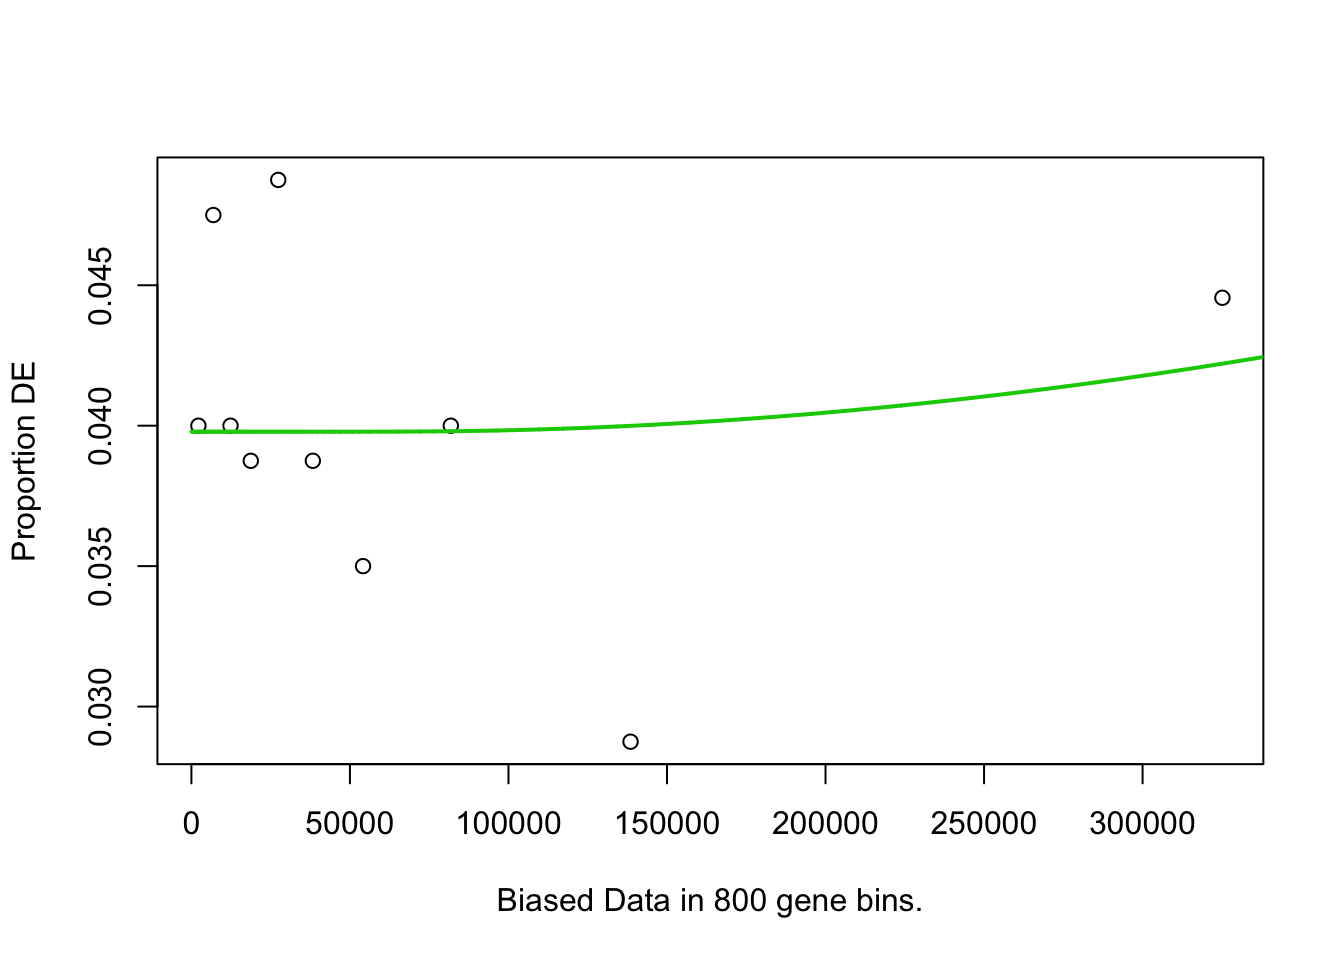
## Fetching GO annotations...## For 605 genes, we could not find any categories. These genes will be excluded.## To force their use, please run with use_genes_without_cat=TRUE (see documentation).## This was the default behavior for version 1.15.1 and earlier.## Calculating the p-values...## 'select()' returned 1:1 mapping between keys and columns## 6h_cluster3-Others## Warning in pcls(G): initial point very close to some inequality constraints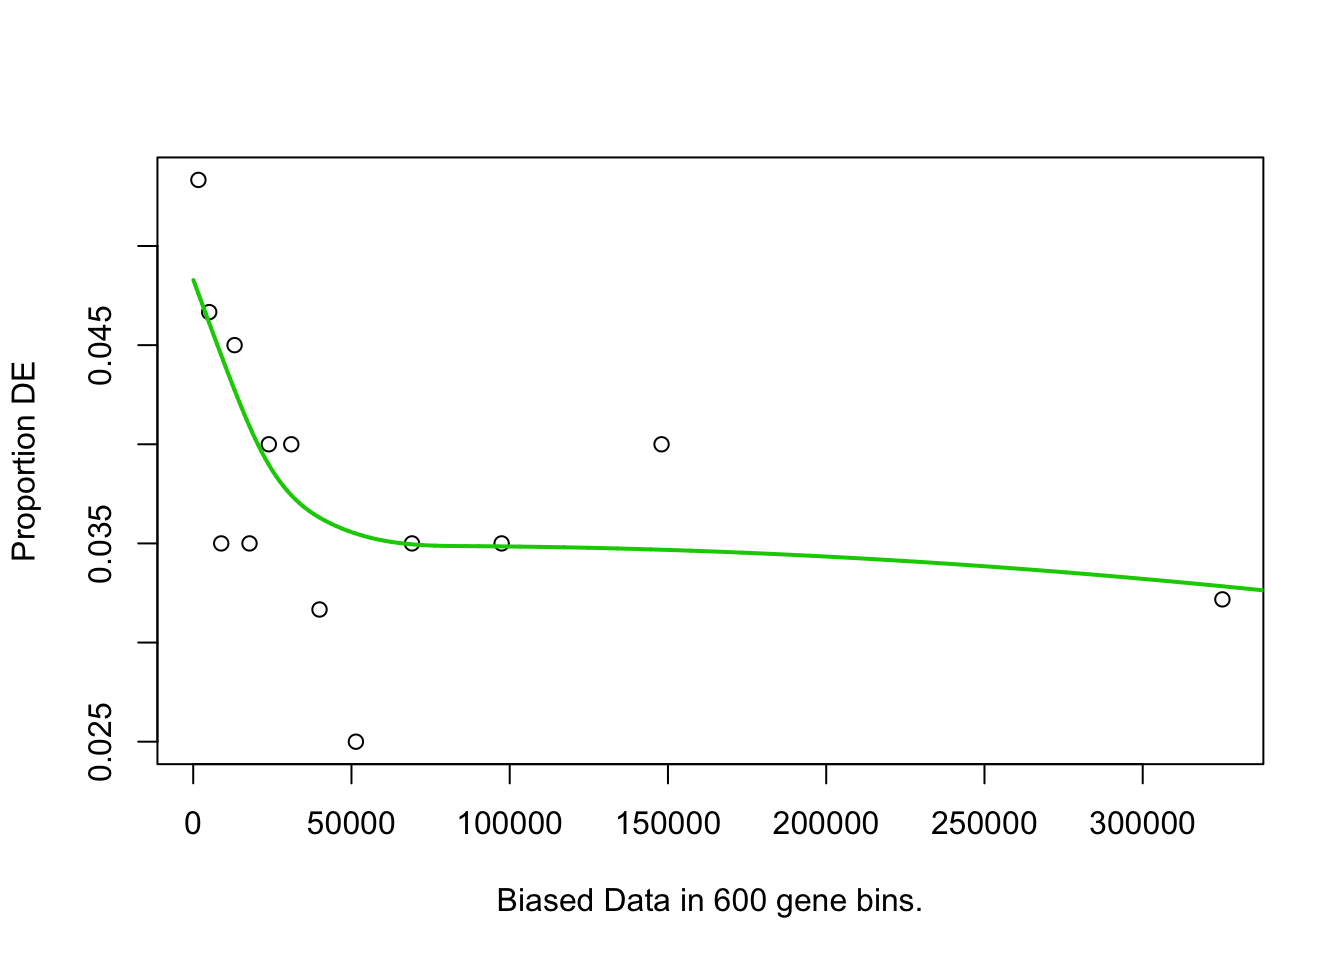
## Fetching GO annotations...## For 605 genes, we could not find any categories. These genes will be excluded.## To force their use, please run with use_genes_without_cat=TRUE (see documentation).## This was the default behavior for version 1.15.1 and earlier.## Calculating the p-values...## 'select()' returned 1:1 mapping between keys and columns