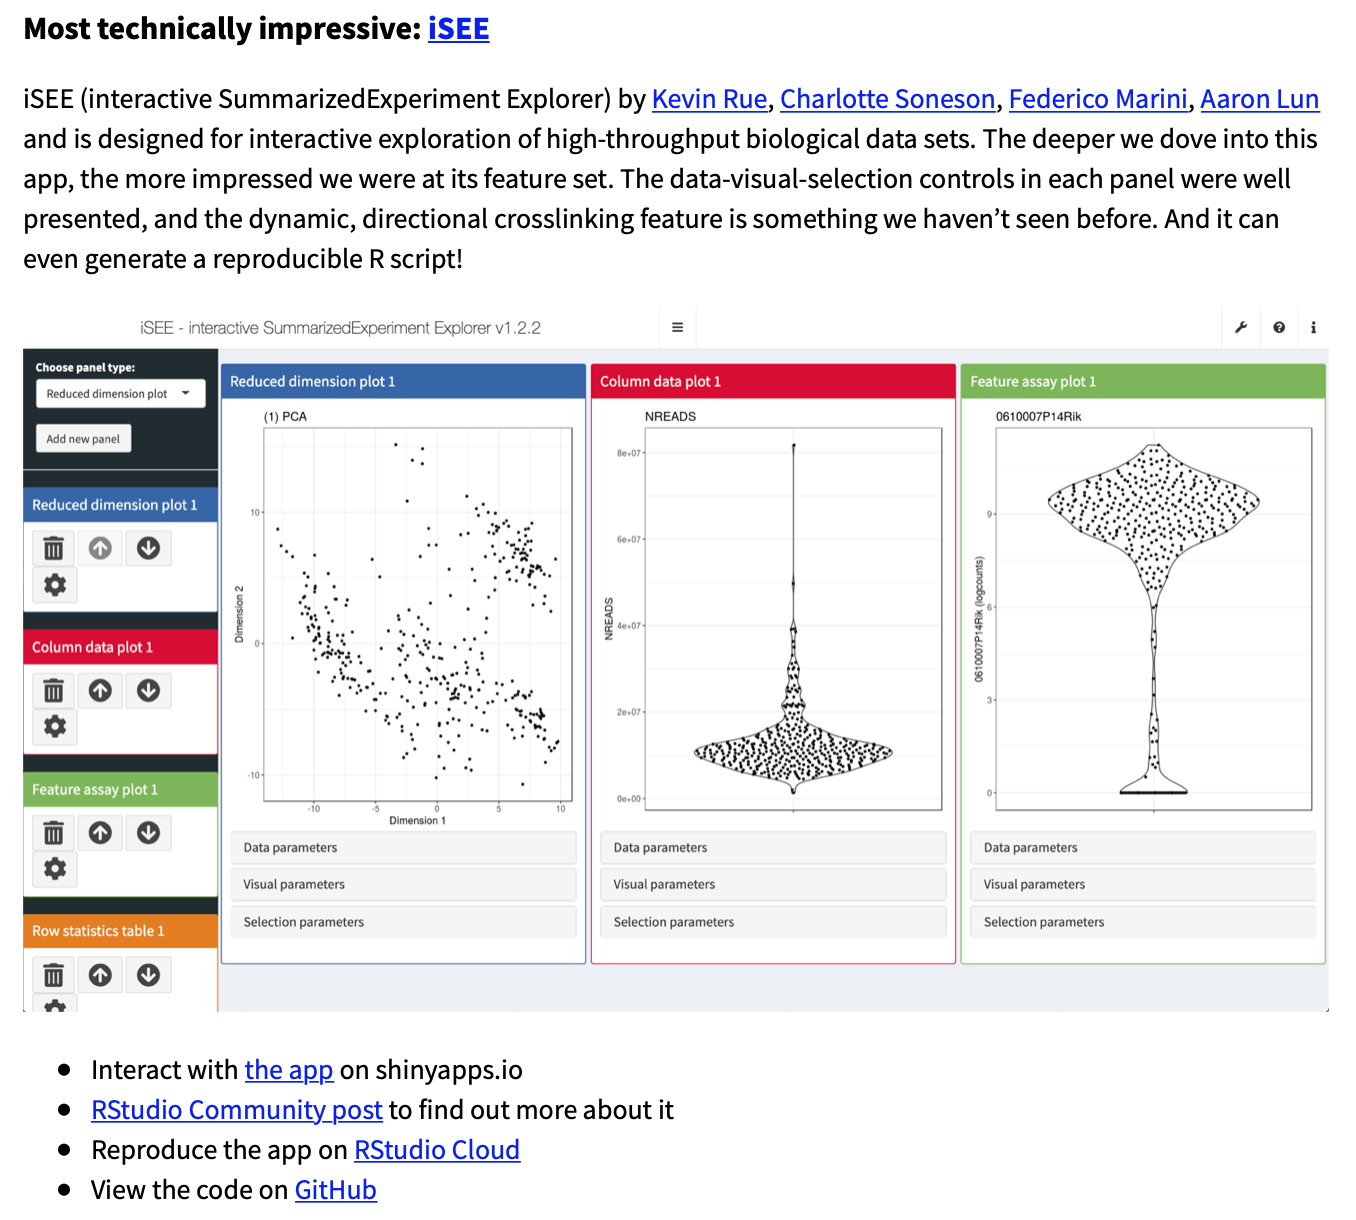
iSEE package and functionality
Bioconductor conference 2019
Kevin Rue-Albrecht & Charlotte Soneson
Twitter: @KevinRUE67 & @csoneson
The team
 |
 |
 |
 |
Original wishlist (1 / 2)
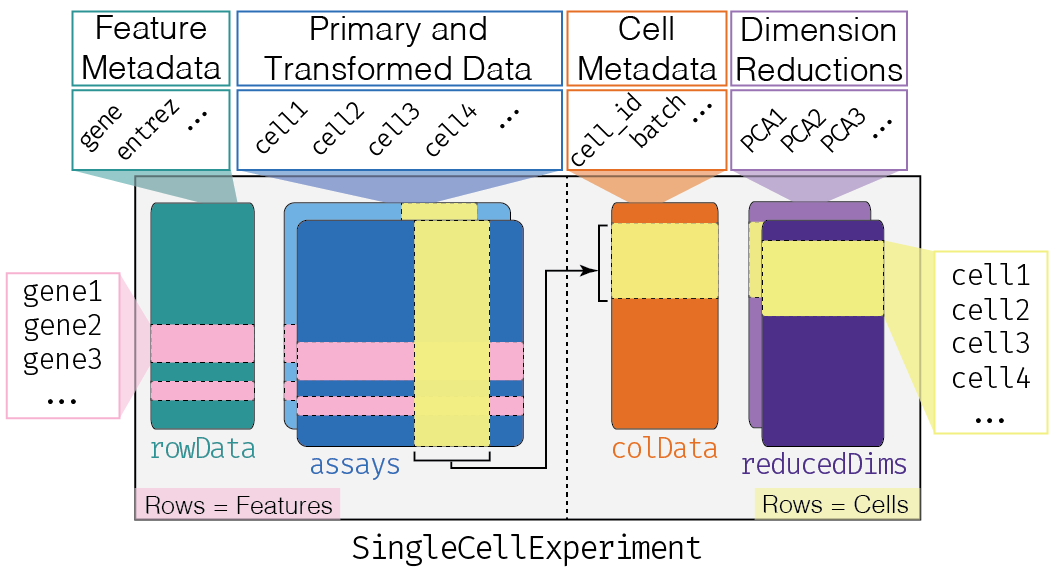
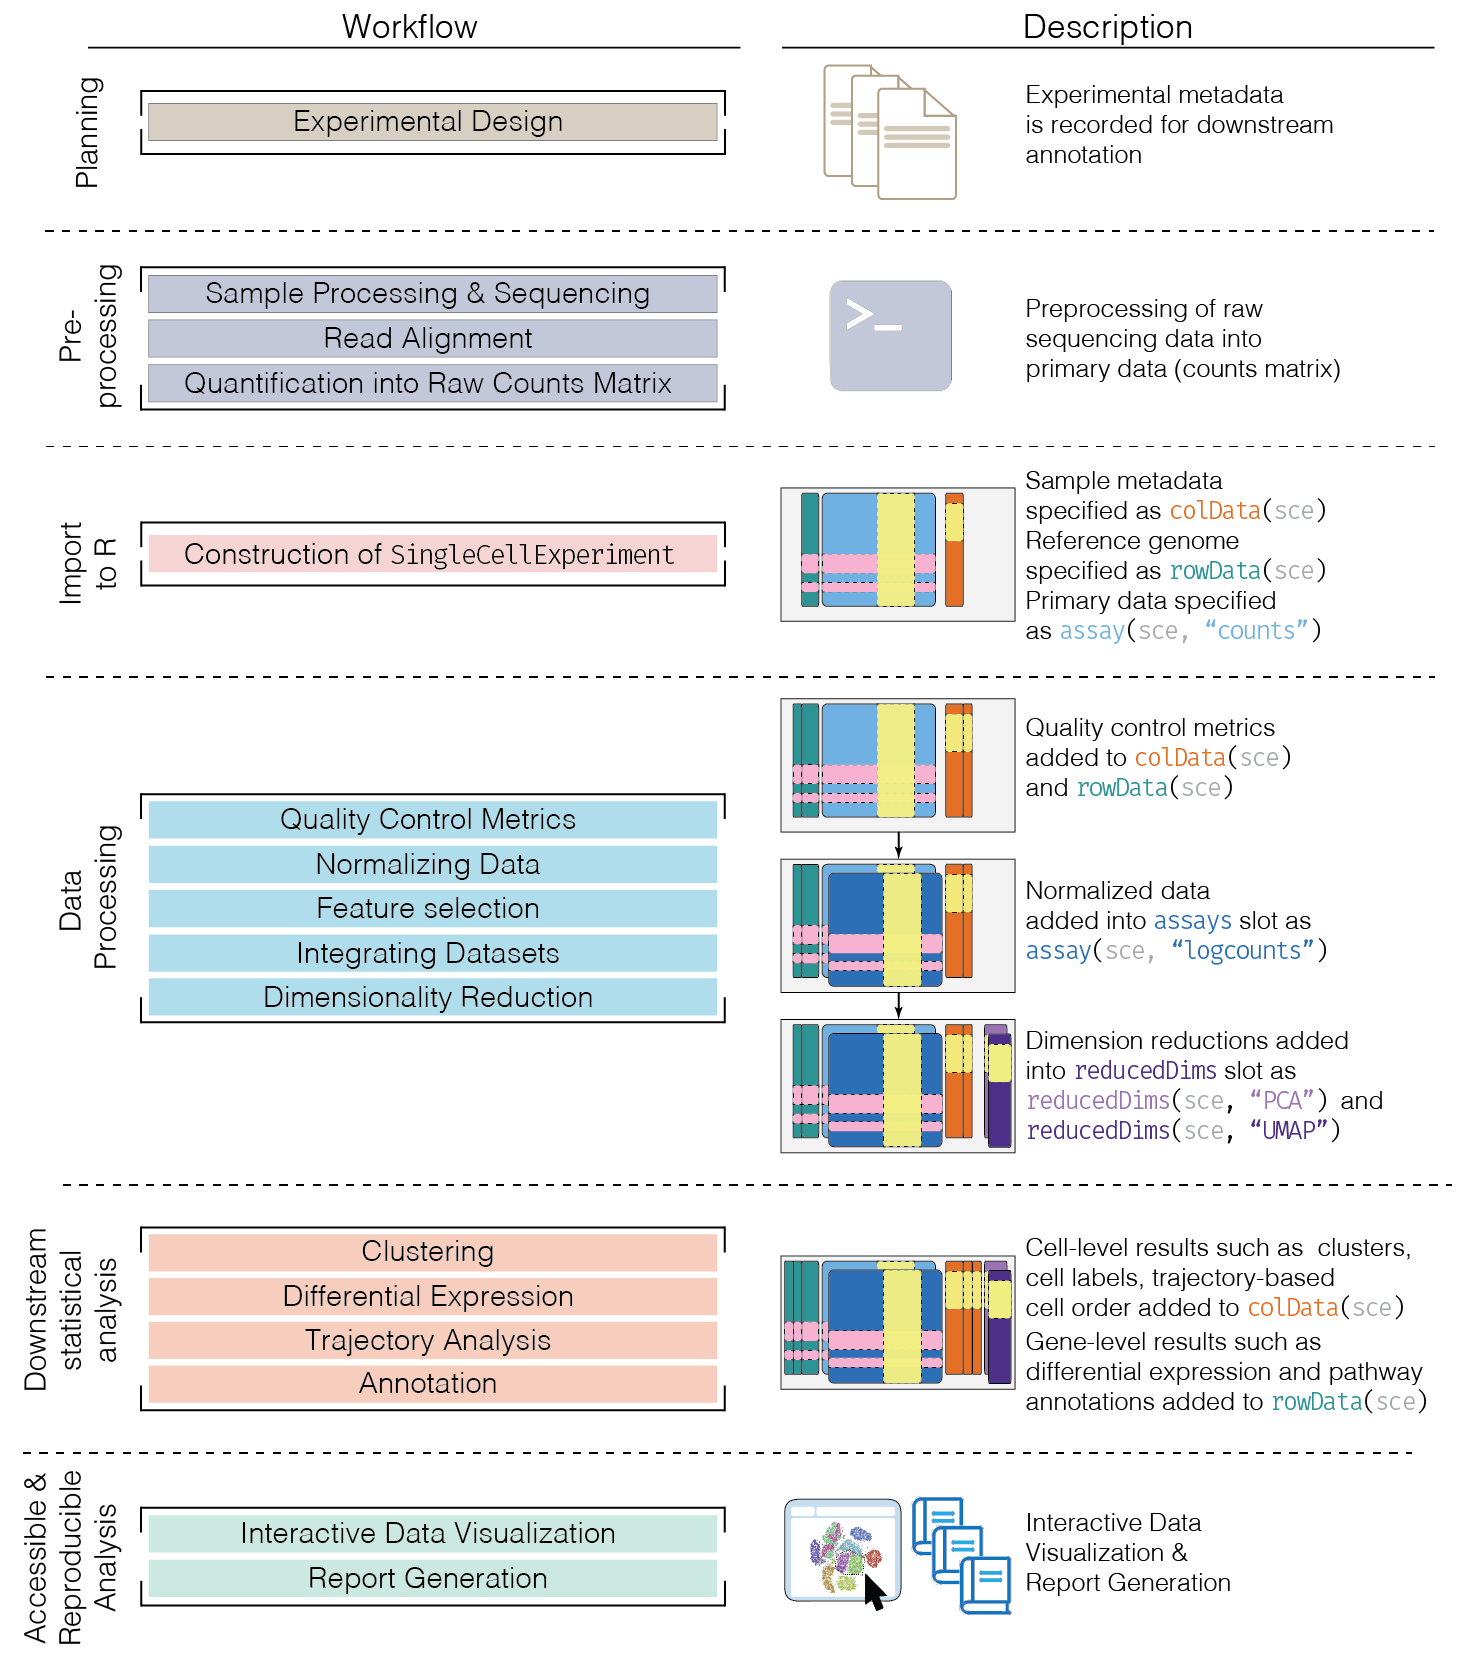
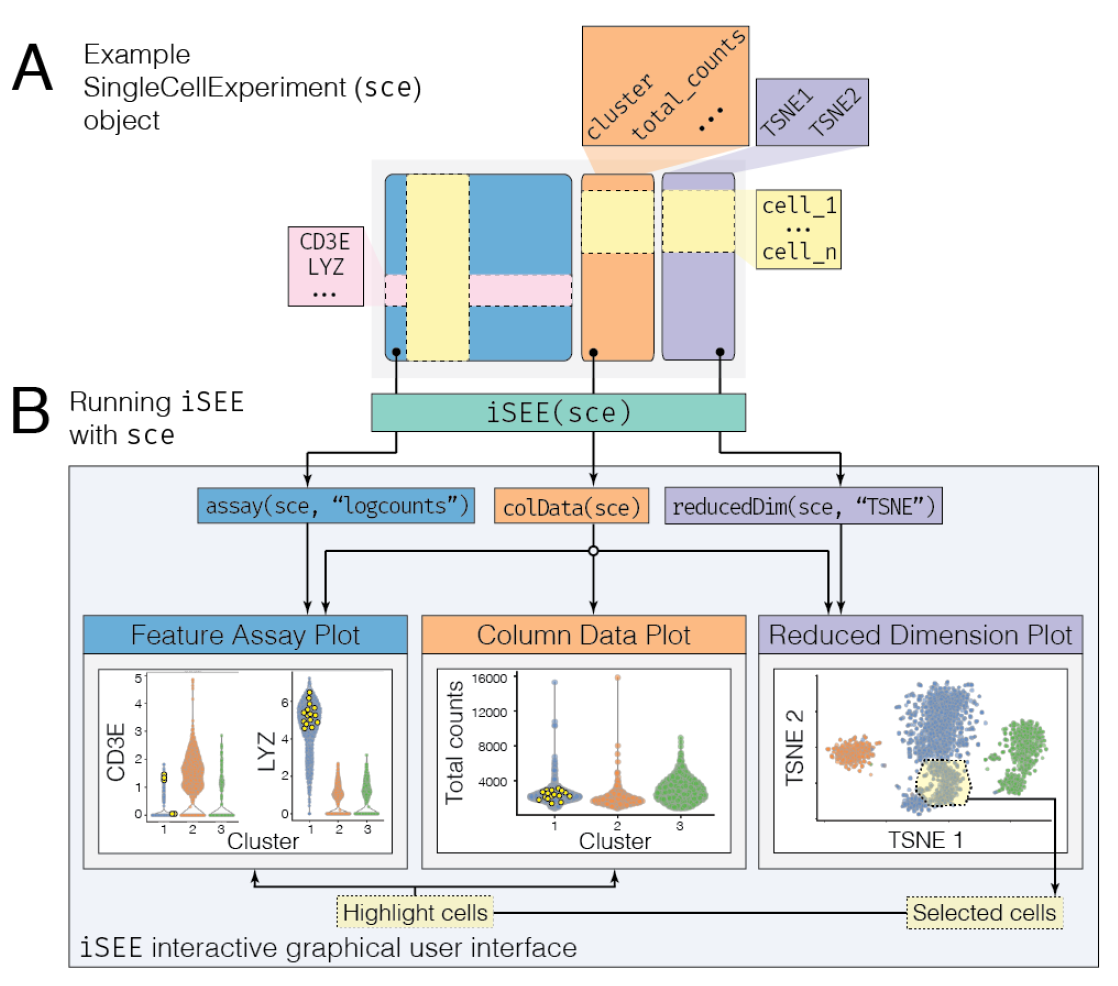
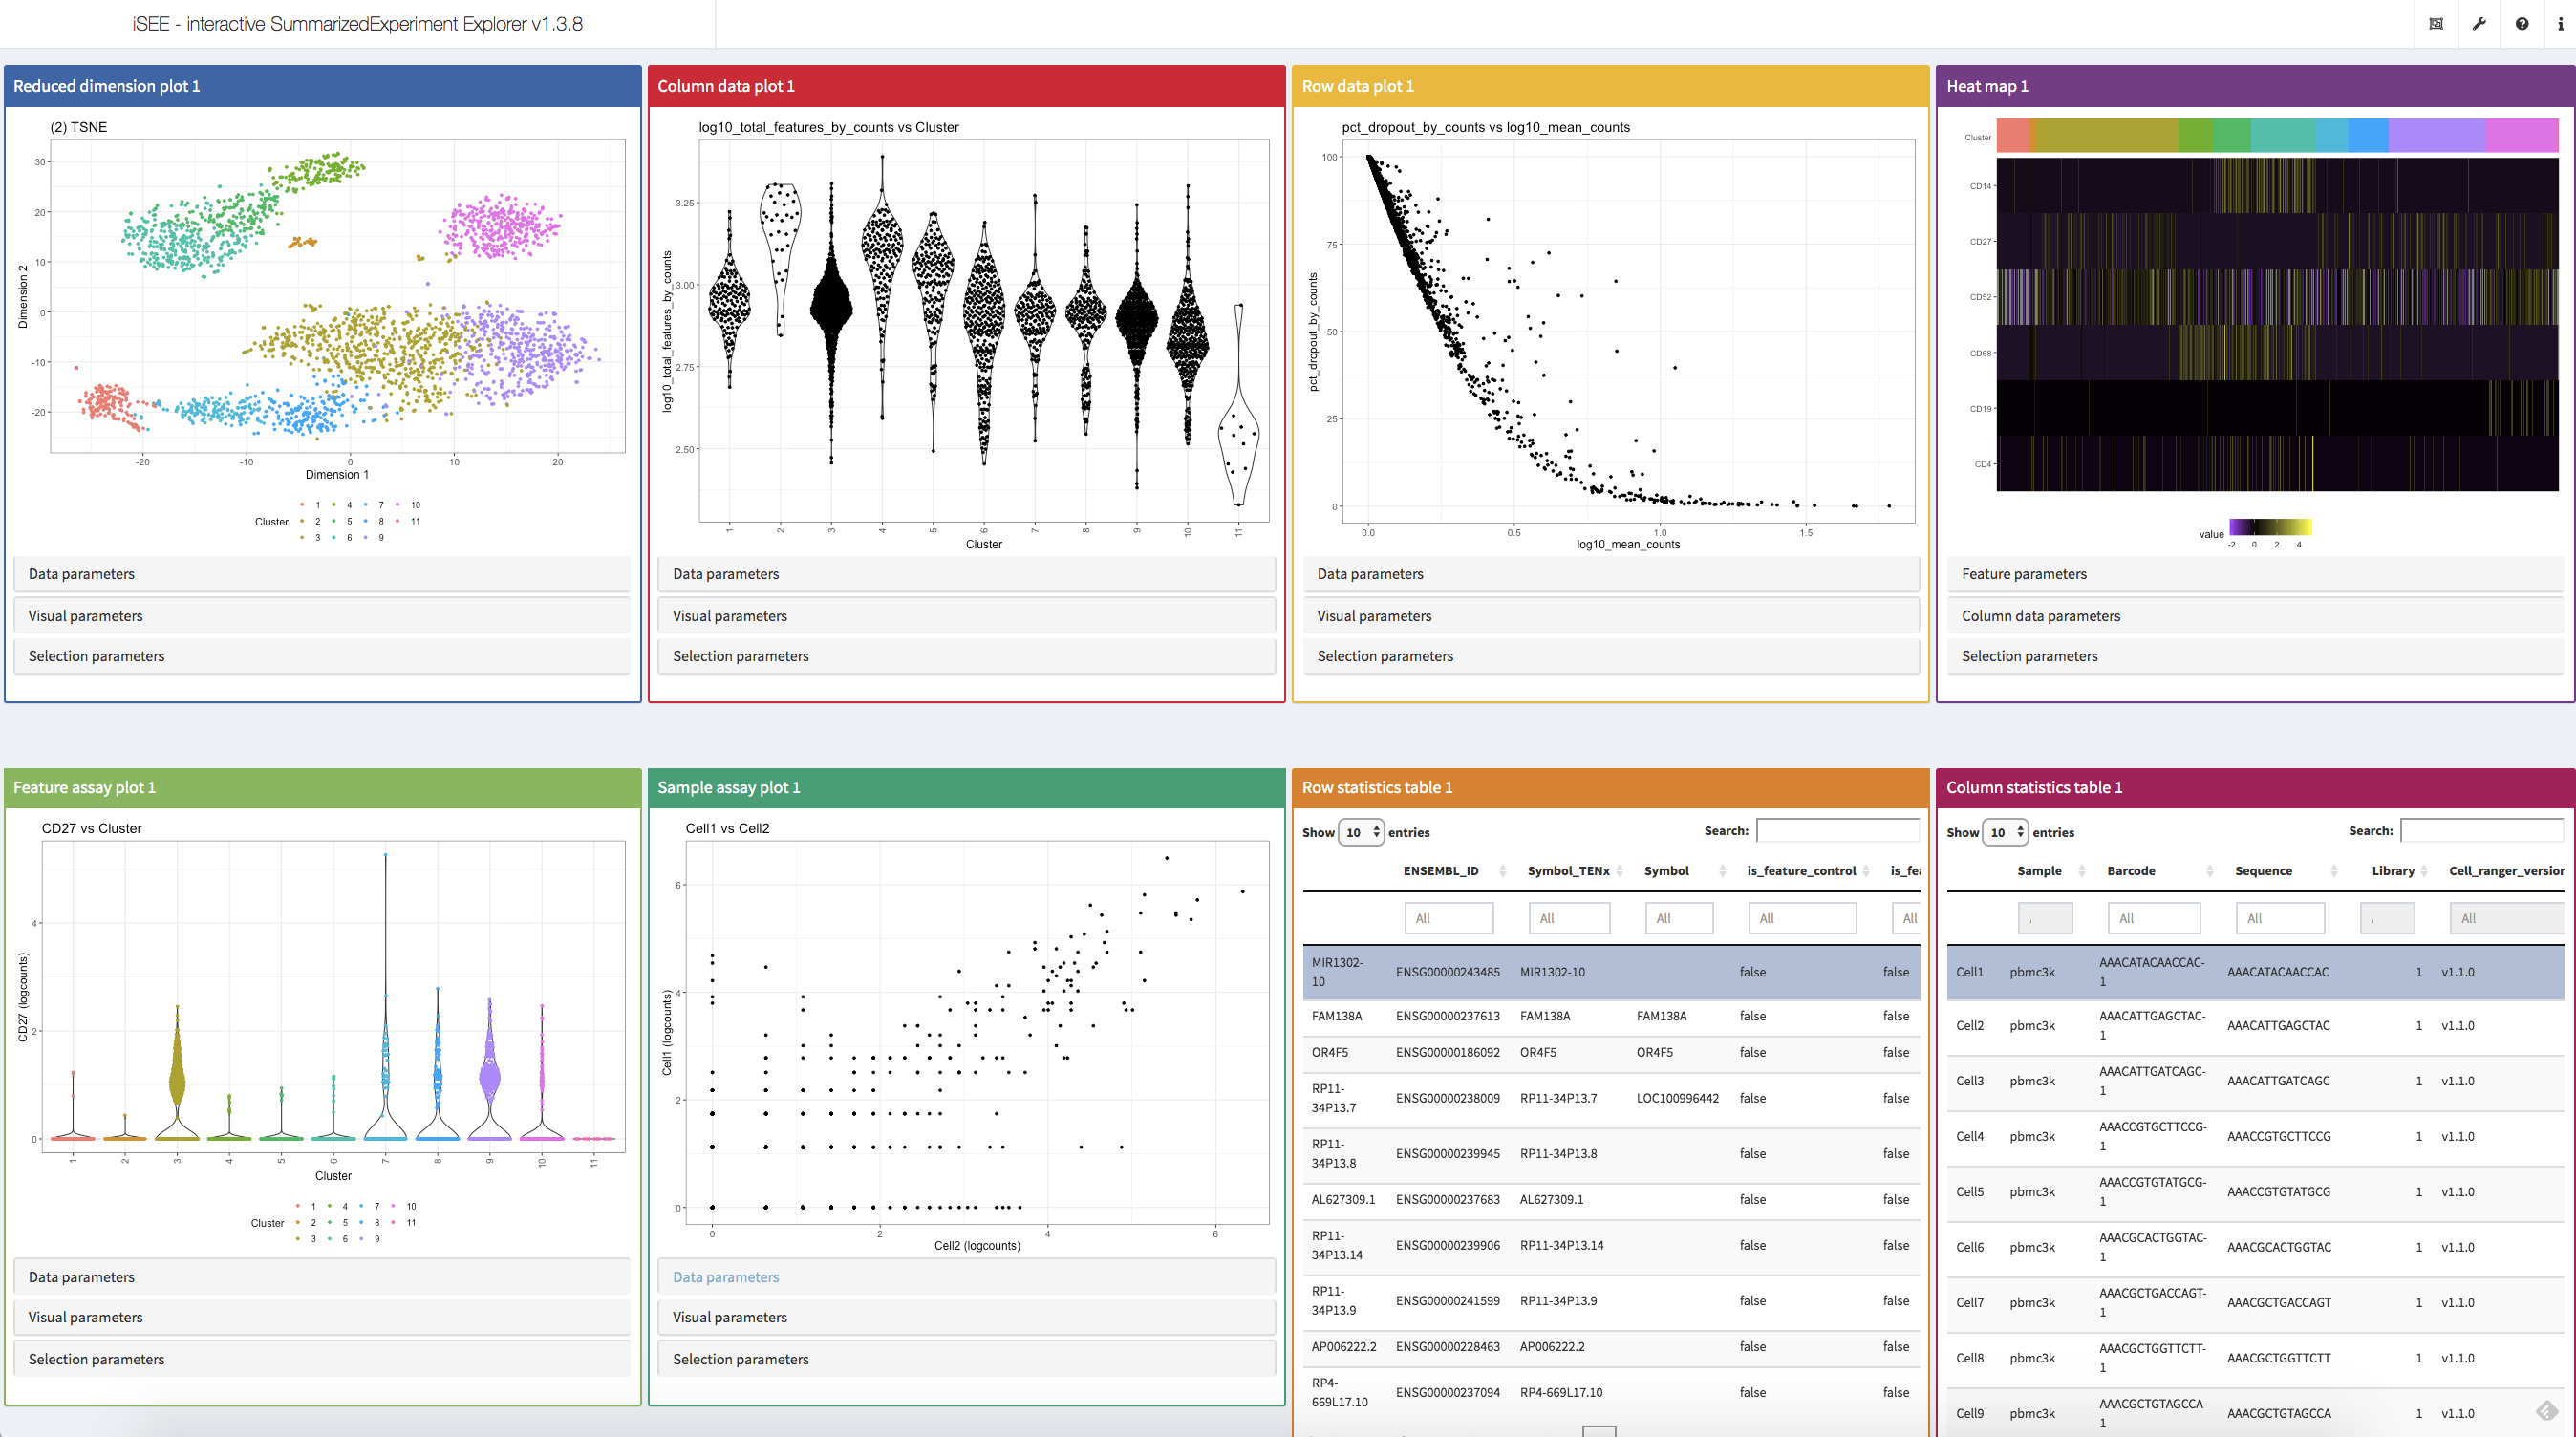
An interactive user interface for exploring data in SummarizedExperiment objects Particular focus given to single-cell data in the SingleCellExperiment derived class Sample-oriented visualizations Feature-oriented visualizations Heat maps (cells and features) Selectable points
Original wishlist (2 / 2)
Colouring of samples by metadata or assayed values Stratify axes and facets by metadata (e.g., violin plots) Hover and click Zoom Transmission of points selections between plots Code tracking for reproducibility and batch generation of figures

iSEE(sce, voice=TRUE)
Creating an ExperimentColorMap
qc_color_fun <- function(n){
    qc_colors <- c("forestgreen", "firebrick1")
    names(qc_colors) <- c("Y", "N")
    qc_colors
}
ExperimentColorMap(
    assays = list(
        counts = heat.colors,
        logcounts = logcounts_color_fun,
        cufflinks_fpkm = fpkm_color_fun
    ),
    colData = list(
        passes_qc_checks_s = qc_color_fun
    ),
    all_continuous = list(
        assays = viridis::plasma
    ),
    global_continuous = viridis::viridis
)
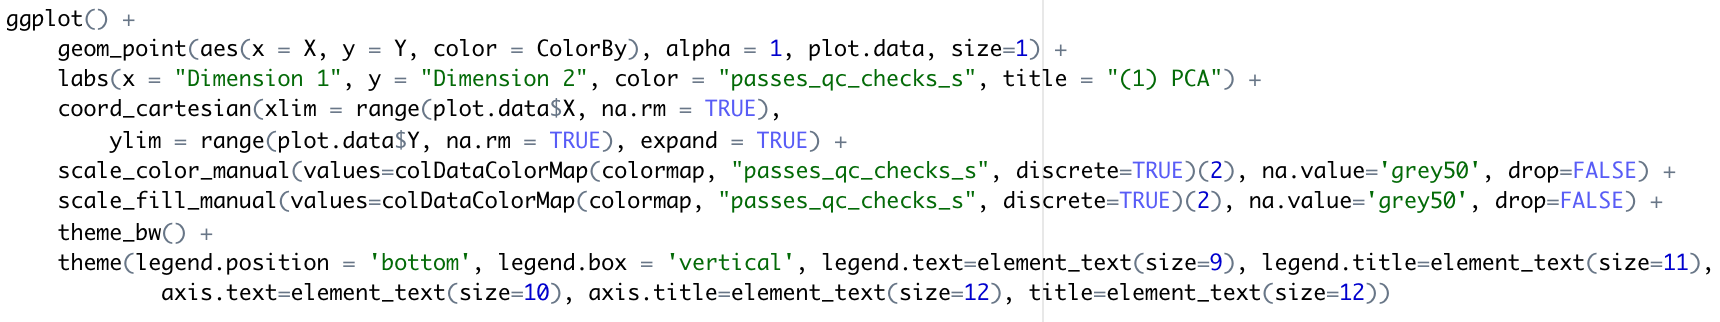
Using an ExperimentColorMap object
colDataColorMap(ecm, "passes_qc_checks_s", discrete=TRUE)
How
iSEE uses the ExperimentColorMap object