COVID-19 Website
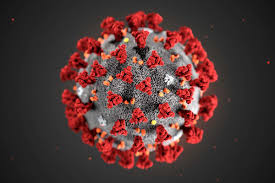 Illustration of the ultrastructure of the Covid-19 virus (CDC/SCIENCE PHOTO LIBRARY)
I have developed
My COVID-19 Website using the data compiled and provided by
the Center For Systems Science and Engineering (CSSE) at Johns Hopkins University (JHU) to generate various interactive figure using the R packages rmarkdown, plotly, and more generally the tidyverse.
Links
| My COVID-19 Website | My COVID-19 Website |
| Blog post | Creating a dynamic Rmarkdown website for COVID-19 data |
| Source data | https://github.com/CSSEGISandData/COVID-19 |
rmarkdown |
https://rmarkdown.rstudio.com/> |
plotly |
https://plotly.com/r/ |
tidyverse |
https://www.tidyverse.org/ |